|
Data Police episode 0: The
warning - data and metaphor |
|
|
|
This is a component of the ad
hoc covid19 data project connected to the FUFF platform (fuff.org) |
|
http://fuff.org/data/cr0.html |
|
|
|
This is still a draft version.
It has to be reviewed and discussed. |
|
|
| 1 |
There appears to be a lot of
misuse and misunderstanding because of unfamiliarity with the complex use of
data and mathematics. |
|
|
| 2 |
The application of mathematics
is metaphorical.
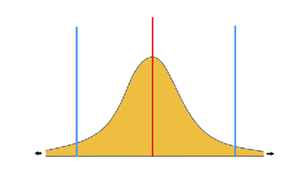
This text is not about proving or arguing that thesis, so let us just
assume that at least a lot of applications are metaphorical
|
|
(* not mathematics itself but
the application) |
|
(If you are not familiar with
the concept of metaphor, you may understand it as describing, though this is
not a satisfying term) |
|
|
| 3 |
Let me explain at a simple
example. |
|
|
| 4 |
Imagine we want to share 4
apples fairly between 2 children |
|
|
| 5 |
Our first attempt is to give
each of them two apples. |
|
|
| 6 |
This is our first application of
mathematics , 4:2=2
|
|
|
| 7 |
Unfortunately one of the two
children is very disappointed. Because one apple is much smaller than the
other three, it feels unfair to the one with the small apple. |
|
|
| 8 |
While the mathematics is correct
in itself, its application has only highlighted a particular property of the
problem (the number of apples) while it has hidden other properties (the
different size). |
|
|
| 9 |
Our second attempt is with
weight. We cut the apples apart and each kid gets the same amount in weight. |
|
|
| 10 |
However we will run into the
same problems again. |
|
|
| 11 |
First of all, they do not get
the same number of apples anymore.
Then they do not get the same consistency, one gets more skin, the other
more core, etc. |
|
|
| 12 |
In later stages you can argue,
that there can not be the same amount of vitamins, molecules, atoms,
electrons, quarks etc. |
|
|
| 13 |
Especially you will find it
impossible to synchronize all levels, as it was abvious with the number and
the grams.
And even if you could for a time point t0, it would not be the same at t1. An apple changes over time, maybe only a little bit, maybe
only a movement of an electron, but it does. Before you have handed it over,
it can not be the same share anymore, as they would drift apart in their
development. |
|
|
| 14 |
So it is impossible to explain
or solve the sharing of 4 apples to 2 children exhaustively. By the
application of mathematics we are only able to highlight particular features
of the problem. But the application is never or almost never an equality. Our
first application had been a simplification, that helped us to understand
something in the first moment but in the same time inhibited further complex
understanding. That goes for every step to some degree. |
|
|
| 15 |
This makes it possible, that
from the same data we can even 'prove' opposite ideas. You will find it quite
often, that the two children from the initial example would argue about the
right method of sharing, directly influenced by interests and ideologies. |
|
That can be even without
malicious intent. Indeed the danger is very high to find just that what
confirms your bias, fears etc. in your metaphorized application of data
mining, data mathematics, data visualising. The role of regions of your brain
in the process here probably resembles the purchase phenomen (one part has
already made an emotional purchase decision before it advised the 'thinking'
part to issue a logical explanation (vindication). |
|
|
|
|
|
|
|
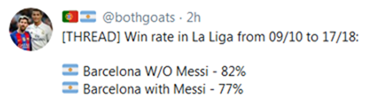
So they are better off without
Messi? With data from the same matches we could prove that Barcelona can not
replace Messi because he provides for the most goals and assists and his
replacements have in no way contributed the same. Yes, the world is more complex
than you would like... |
|
|
| 16 |
The next trap we fall into is
the underrating of mathematical phenomens/properties, that go against our
intuition and experiences of relations, in example of mass, velocity
etc.
|
|
|
| 17 |
One example is understanding of
exponential growth. |
|
|
| 18 |
Another is, how different the
application of averages can influence our results and misleadiung of
understanding |
|
|
| 19 |
|
|
|
| 20 |
Example: the average of 2 and 6
is… 4. But 4*4=16 and 2*6=12. You cannot just substitute differenciated
factors with averages, just because you think "well ok it will not be
exact, but somehwere close".
If now you have chains of calculations, the differences become huge. For
example to describe people passing on a virus to a number of other people and
they again to others and so on. Here you have multiplication chains and a
huge range in the possible result just by adjusting a few tiny initial
parameters. There it makes a huge difference as the difference multiplies
with every step.
This also goes for multiplying distributions, confiedence intervals and
probabilities that lie outside confidence intervals. |
|
|
| 21 |
What is a distribution? |
|
|
| 22 |
Think of the famous R0 value. It
is an average how many other persons one person has infected. (We get into
dangerous territory right away) |
|
|
| 23 |
It is a retrospective
calculation. This average is a result from a process where a lot of different
people have infected a hugely varying number of others in hugely varying
contexts and in a varying period of time. |
|
|
| 24 |
Example: Imagine a dice with
five equal sides (we take 5 instead of 6 because the point becomes clearer).
All results have the same probability. So the average result will be 3. BUT
80% of the results will not be a 3. |
|
|
| 25 |
If R0 is 2.7, nobody has
infected 2.7 others. A few will have infected 20 or more, some between 5 and
19, several between 1 and 4, and several will have infected nobody at
all. |
|
|
| 26 |
So in reality you will have a
so-called distribution. Often that is a bell shape like the one below. Though
-spoiler- in our case is not a so called 'normal distribution'. It isn't even
symmetrical but some other (assymetrical) form, maybe not even of this shape. |
|
|
| 27 |
The most instances usually are
within a 'confidence interval'. In a free invented example: the most
individual Rs would for example be between 0 and 7. |
|
|
| 28 |
BUT some results will be outside
of that interval. And although they are unlikely, they are nevertheless sure
to happen if you just try long or often enough or have enough cases. In our
example this is occurences like "patient #31" in Korea, who is
suspected to have infected hundreds. |
|
|
| 29 |
Now if you multiply those
distributions your 'tail risks' tend to get bigger and more. And your
confidence interval is getting wider, too. |
|
|
| 30 |
So without understanding this,
we make two intuitive mistakes when hearing of results of models and
projections. |
|
|
| 31 |
The first mistake is
understanding the central value/average of a distribution (the red value in
the graphic above) as the quite likely outcome.
Think back to the example with the 5-way dice. The 3 is the average, and so
the expected average outcome. BUT it is actually in 80% of the cases NOT the
outcome in the real world.
You can have distributions where the curve is very narrow and steep and
that 3 would be a quite good notion of what 'reality' will produce but you
can also have distributions where hugely varying results are possible and
likely. But we have demanded a value and are unwilling to understand the
complexity of the result because it is so much more inviting to understand
that one number as the mathematical answer where it is not. That goes for
this example as much as for the Imperial college's projection of real
infections in a country. |
|
|
| 32 |
The second mistake is
underestimating the risk of a result outside the 'confidence interval'. There
is even a risk of miscalculating that value (or assuming the wrong
distribution model). But another quality risk lies in the disregard of a
considerable risk might be in a context where this risk would not just lead
to a relative error but a whole collapse of a system. |
|
|
| 33 |
Now back to R0. We have learned
that this is a result from a calculation in retrospective.
Now what happens if we feed a model with that value? First of all it is an
entirely unrealistic model if all persons in that model have the same R0. In
that case the model is only good to demonstrate some particular mathematical
properties of the complex. It is like in our apple example, just a metaphor
to highight particular features of the situation but it might lead us astray
if we take the result as it is and not assume a highly diverting outcome,
maybe even a different behaviour of the model in our real world problem. |
|
|
| 34 |
|
|
|
| 35 |
Not applying mathematics at all?
Not reading numbers anymore? Not looking at visualisation? |
|
|
| 36 |
No, they help us. Imagine you
would not have had no clue how to share the apples and left it to a draw or a
fight. That would not have had fairer results at all. |
|
|
| 37 |
Learn! Be careful! Know there is
always the next level behind. And try to scrutinize. And be aware, watch
yourself how you pick data, calculations, visualisations to prove your bias
to yourself and others. |
|
|
|
please discuss |
|
|
|
|
|
|
|