| This is a component of the ad hoc covid19
data project connected to the FUFF platform (fuff.org) |
|
|
|
|
|
|
|
|
|
|
| http://fuff.org/data/cr0.html |
|
| At
the bottom of this page are tabs. they link to the other sheets/pages |
|
|
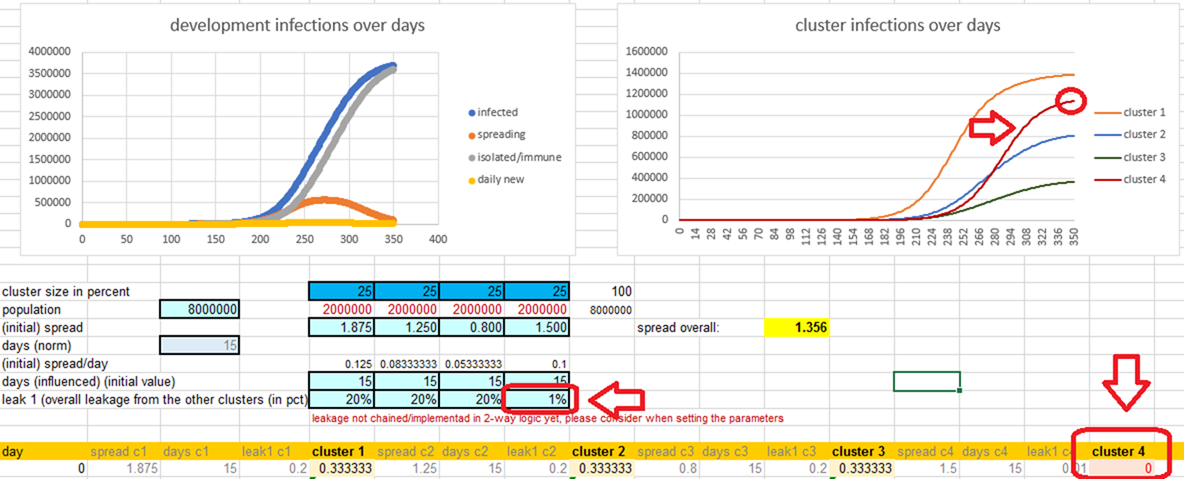
| example
result only for simplified 4 cluster simulation |
|
|
|
| the
risk with protecting risk groups |
|
|
|
|
|
|
|
|
|
| example
case: |
|
| an
example of 4 clusters |
|
| #1
has higher activities and/or is more freuently exposed, #2 is not in physical
distancing but working out of home |
|
| #3
is very careful and able to distance themselves, but still has a considerable
amount of necessary contact |
|
| #4
is a protected risk group. But a lot of its members are dependable of help
through contacts with high exposure. |
|
| Others are gathered together in nursery
homes, hospitals etc.. So the inner spreading probability of the cluster is
higher than group #3, once the virus gets through the protection. |
|
| Even
cluster #3, who would normally have no problems with a prob of 0.8 get a
reasonable amount of infections through the leakage from cluster #1 (and #2) |
|
|
|
|
|
| As
long as the spread probability per person within the risk cluster is not a
lot below 1, it is very difficult to protect a risk group. |
|
| Why
a lot below? See the dangers of averages example. Because it is only an
average of subclusters/indivdiual persons with different probabilities. |
|
| This
may be difficult if not impossible for nurse homes, hospitals etc. |
|
| The
reason is you have to consider the caring persons as a (potentially
superspreading) subcluster of the protected risk cluster (and not as a
separate cluster overspilling). |
|
| The
overspill then is either the infection of a caring person from outside or
through a person from inside that has been infected by a visitor or another
accident. |
|
| Even
if careful it is a matter of time. |
|
|
|
|
|
|
|
|
|
|
|
|
|
|
|
|
|
|
|
|