| At the bottom of this page are tabs. they
link to the other sheets/pages |
|
|
|
|
|
|
|
|
|
|
|
|
|
|
|
|
|
|
|
|
|
|
| html
version: |
|
http://fuff.org/data/cr2.html |
|
| important
for html export: if you come back for updated versions, you have to refresh
every single page!! sorry |
ein |
|
|
| google sheet link here: |
|
http://fuff.org/data/cr0.html |
|
| important
for google sheets export: I might replace this with a new google sheet so
check that link above for the active google sheet link!! |
|
| important
for google sheets: I am not sure it really behaves the same in all details
(matrix formula etc.). better ask for the excel version! |
|
|
| simulation |
|
|
|
|
|
|
|
|
|
|
|
| ->
read tab 'about and howto'
for important explanations! |
|
|
|
| The
parameters have been reset to initial values. They are not adjusted to an
actual scenario. BUT the model is preset so that cluster 4 starts with 0
infected people |
|
| If
you want to change that: to adjust this correctly you will have to modify all
4 initial values for the 4 clusters (the first row of data)! |
|
|
|
|
|
|
|
|
|
|
|
|
|
|
|
|
|
|
|
|
|
|
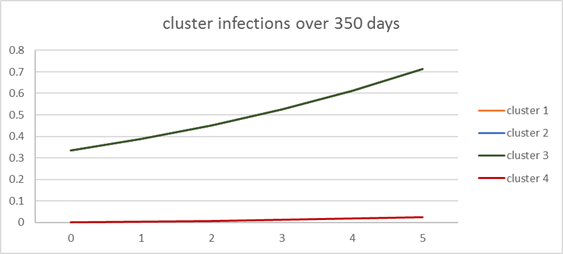
| cluster
size in percent |
|
25 |
25 |
25 |
25 |
|
100 |
|
| population |
|
8000000 |
|
2000000 |
2000000 |
2000000 |
2000000 |
|
8000000 |
|
| (initial) spread |
|
2.500 |
2.500 |
2.500 |
2.500 |
|
|
spread overall: |
2.500 |
|
|
| days (norm) |
|
15 |
|
| (initial)
spread/day |
|
0.16666667 |
0.16666667 |
0.16666667 |
0.16666667 |
|
|
| days
(influenced) (initial value) |
|
15 |
15 |
15 |
15 |
|
|
| leak
1 (overall leakage from the other clusters (in pct)) |
5% |
5% |
5% |
5% |
|
|
| leak 2 (leakage from
neighbouring clusters in pct) |
|
|
|
|
|
|
|
|
|
|
|
|
|
|
|
|
|
|
|
|
|
|
|
|
leakage not
chained/implementad in 2-way logic yet, please consider when setting the
parameters |
|
|
|
|
|
| day |
spread c1 |
days c1 |
leak1 c1 |
leak2 c1 |
cluster 1 |
spread c2 |
days c2 |
leak1 c2 |
leak2 c2 |
cluster 2 |
spread c3 |
days c3 |
leak1 c3 |
leak2 c3 |
cluster 3 |
spread c4 |
days c4 |
leak1 c4 |
leak2 c4 |
cluster 4 |
|
sum |
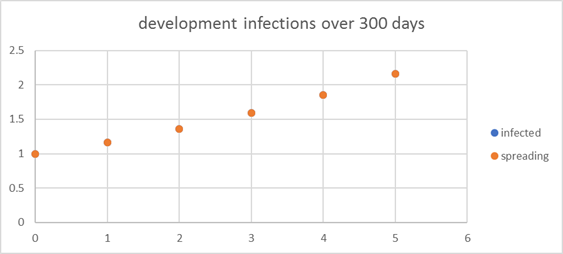
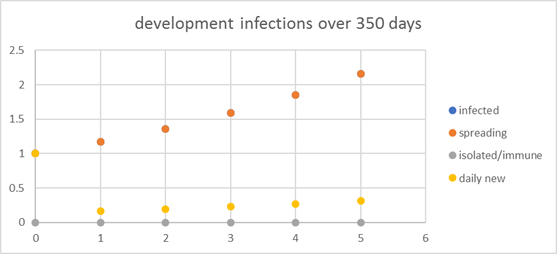
overall spread |
yet spreading |
immune or isolated (incl.
fatalities) |
daily new |
| 0 |
2.5 |
15 |
0.05 |
0 |
0.333333 |
2.5 |
15 |
0.05 |
0 |
0.333333 |
2.5 |
15 |
0.05 |
0 |
0.333333 |
2.5 |
15 |
0.05 |
0 |
0 |
|
1 |
1 |
1 |
0 |
1 |
| 1 |
2.5 |
15 |
0.05 |
0 |
0.387963 |
2.5 |
15 |
0.05 |
0 |
0.387963 |
2.5 |
15 |
0.05 |
0 |
0.387963 |
2.5 |
15 |
0.05 |
0 |
0.002778 |
|
1.16666664 |
17.4999996 |
1.16666664 |
0 |
0.16666664 |
| 2 |
2.5 |
15 |
0.05 |
0 |
0.451553 |
2.5 |
15 |
0.05 |
0 |
0.451553 |
2.5 |
15 |
0.05 |
0 |
0.451553 |
2.5 |
15 |
0.05 |
0 |
0.006451 |
|
1.36111104 |
|
1.36111104 |
0 |
0.1944444 |
| 3 |
2.5 |
15 |
0.05 |
0 |
0.525576 |
2.5 |
15 |
0.05 |
0 |
0.525576 |
2.5 |
15 |
0.05 |
0 |
0.525576 |
2.5 |
15 |
0.05 |
0 |
0.011235 |
|
1.58796283 |
|
1.58796283 |
0 |
0.22685179 |
| 4 |
2.5 |
15 |
0.05 |
0 |
0.611743 |
2.5 |
15 |
0.05 |
0 |
0.611743 |
2.5 |
15 |
0.05 |
0 |
0.611743 |
2.5 |
15 |
0.05 |
0 |
0.017394 |
|
1.85262324 |
|
1.85262324 |
0 |
0.2646604 |
| 5 |
2.5 |
15 |
0.05 |
0 |
0.712049 |
2.5 |
15 |
0.05 |
0 |
0.712049 |
2.5 |
15 |
0.05 |
0 |
0.712049 |
2.5 |
15 |
0.05 |
0 |
0.025245 |
|
2.16139368 |
|
2.16139368 |
0 |
0.30877045 |
|
| …. |
and so on |
|
|
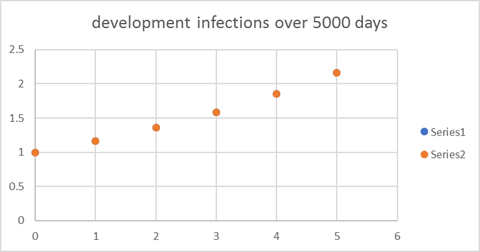
the model has 5013 days
but it makes no sense to display that in html as it is 100MB. so please look
at the google sheet version or better, ask for the Excel by mail. |
|
|
|
| 5011 |
2.5 |
15 |
0.05 |
0 |
1801467 |
2.5 |
15 |
0.05 |
0 |
1801467 |
2.5 |
15 |
0.05 |
0 |
1801467 |
2.5 |
15 |
0.05 |
0 |
1801835 |
|
7206234.53 |
|
0 |
7206234.53 |
0 |
| 5012 |
2.5 |
15 |
0.05 |
0 |
1801467 |
2.5 |
15 |
0.05 |
0 |
1801467 |
2.5 |
15 |
0.05 |
0 |
1801467 |
2.5 |
15 |
0.05 |
0 |
1801835 |
|
7206234.53 |
|
0 |
7206234.53 |
0 |
| 5013 |
2.5 |
15 |
0.05 |
0 |
1801467 |
2.5 |
15 |
0.05 |
0 |
1801467 |
2.5 |
15 |
0.05 |
0 |
1801467 |
2.5 |
15 |
0.05 |
0 |
1801835 |
|
7206234.53 |
|
0 |
7206234.53 |
0 |
|
|
|
|
|
|
|
|
|
|
|
|
|
|
|
|
|
|
|
|
|
|
|
|
|
|
|