| This is a component of the ad hoc covid19
data project connected to the FUFF platform (fuff.org) |
|
|
|
|
|
|
|
|
|
|
|
|
| http://fuff.org/data/cr0.html |
|
| The
example is made with the simulation model that is linked from there. |
|
|
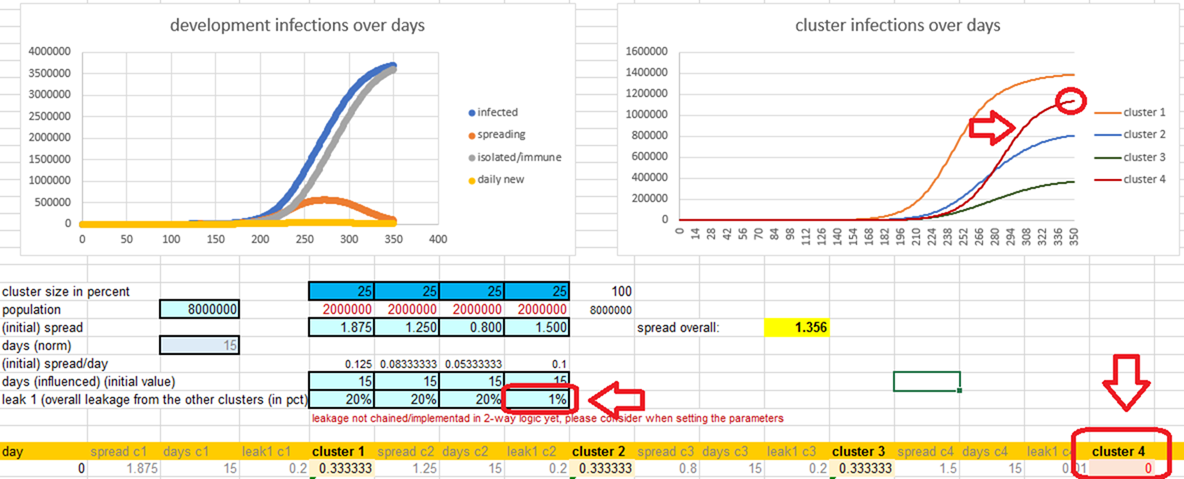
| example
result only for simplified 4 cluster simulation |
|
|
|
| the
risk with protecting risk groups |
|
|
|
|
|
|
|
|
|
| I
chose the simplified model of 4 clusters to demonstrate that (-depending on
the chosen parameters!-) the intention of protecting a risk group cluster
against clusters with a considerable virus activity can go wrong badly. |
|
| And
this, even mathematically. However, -disclaimer-, I want to encourage you to
read on the pitfalls of applying mathematical models in the ressources under
the link at the top of this page. |
|
|
| example
case: |
|
|
|
|
| an
example of 4 clusters |
|
| #1
has a higher activitiy rate and/or is more frequently exposed through jobs |
|
| #2
is not in physical distancing but working out of home |
|
| #3
is very careful and able to distance themselves, constrained to necessary
contacts. |
|
| #4
is a protected risk group. But several of its members are locally or socially
interconnected and are dependable of help through hub structured contacts
with high exposure. |
|
| Especially those who are gathered together
in nursery homes, hospitals etc.. So the inner spreading probability of the
cluster will be higher than the one of group #3, if the virus penetrates over
the protection walls somehow. |
|
|
|
|
|
| The
result with the selected parameters (see the screenshot): |
|
| In
average -in this model- you will have significant spillover effects, so that
the cluster that you intended to protect will instead come out with a huge
number of infections nevertheless. |
|
| Provided
that cluster was to be protected for a reason, this effect is
devastating. |
|
| Even
cluster #3, who would normally have no problems with a prob of 0.8 get a
reasonable amount of infections through the leakage from cluster #1 (and #2) |
|
|
| As
long as the spread probability per person within the risk cluster is not a
lot below 1, it is very difficult to protect a risk group. |
|
| (Why
a lot below? See the dangers of averages example. Because it is only an
average of subclusters/indivdiual persons with different probabilities.) |
|
| This
may be difficult if not impossible for nurse homes, hospitals etc. |
|
| The
reason is you have to consider the caring persons as a (potentially
superspreading) subcluster of the protected risk cluster (and not as a
separate cluster overspilling). |
|
| The
overspill then is either the infection of a caring person from outside or
through a person from inside that has been infected by a visitor or another
accident. |
|
| Even
if you are careful, mathematically it is a matter of time and the frequency
of occurences is dependent on the situation in the other clusters. |
|
| Consider
that risk groups that are not 'seperated' into hospitals and nurse homes, are
to a good part socialised in an analogue way. |
|
|
| In
reality you have numerous of those cluster situations, all with different
sets of parameters (and more complex). |
|
| Such
you will have various results, what implies the enhanced probability of at
least some of those risk group protection scenarious will fail. |
|
|
|
|
|
| I
deliberately chose that simplified model so the point of overspilling into a
high potential cluster is easier to understand. |
|
| For
further understanding I recommend to experiment with the 32 cluster variant,
where you can define more clusters of different context. |
|
|
|
| experiment
yourself… |
|
| http://fuff.org/data/cr0.html |
|
|
|
|
|
|
|
|
|
|
|
|
|
|
|
|
|
|
|
|
|
|