| This is a component of the ad hoc covid19
data project connected to the FUFF platform (fuff.org) |
|
|
|
|
|
|
|
|
|
|
|
|
|
| http://fuff.org/data/cr0.html |
|
| this
is an example result from the experimental simulation model you find under
the adress |
|
| http://fuff.org/data/cr0.html |
|
|
| the
dangers of averages |
|
|
|
|
|
|
|
|
|
| everybody
knows that 2*6 <> 4*4 although 4 is the average of 2 and 6. But as
apparent as that is, related misconceptions hide everywhere where you might
happily apply seemingly simple probabilities and probability chains. |
| in the
following I try to show for a very simple probability based infection model,
how clusterization can flip a whole scenario on its head (because of the
aforementioned properties of the application of averages). |
|
|
|
| disclaimer:
this model is a grossly simplified abstract to demonstrate mathematical
properties and dangers in applying 'right' mathematics in the wrong context -
don't use it to jump on conclusions for real scenarios! |
|
| |
|
| but even
with this simple approach I can demonstrate to you what terrible difference
wrong application of averages, aggregations and values can do |
|
| (- and why
I implemented a clustered model at least): |
|
|
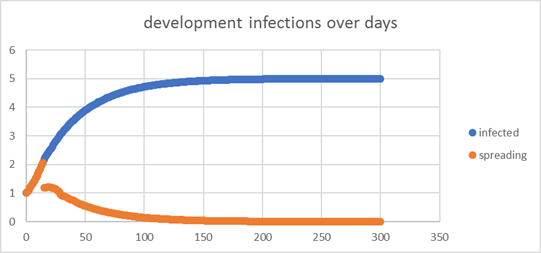
| think of a
simulation where the spread/person (a value closely related to the famous R0)
is only 0.8 over the whole population |
|
| it means
that each infected person in the model would spread a virus to 0.8 others
(here over a strech of being infectous for 15 days before becoming
muted): |
|
| beginning
with 1 infected perosn, now here is what happens: |
|
|
| one
cluster, all persons are average persons |
|
| population: |
80,000,000 |
|
devide: |
100 |
0 |
|
depth: |
1 |
|
days: |
15 |
|
|
|
|
|
| In average
5(!) people would be infected after 300 days |
|
| ->
now that is an average(!), too. In reality it is a distribution and it could
be 0, or could be several hundred. It is a set of probabilities centering
around the 5, not a concrete result! |
|
|
|
| However,
the point I want to show here is the following: |
|
|
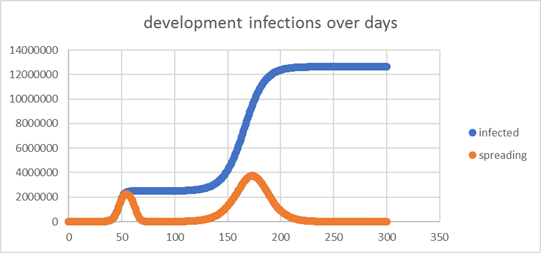
| below is
what happens if the persons in the model have a spread probability of 0.8 in average |
|
| but
individually they would have different spread probabilities, one had 1.5, one
0.5, one 0.4 etc. |
|
| In this
model this is simulated by clusters of higher and lower spread/person
averages. |
|
| Why? ->
We would assume that there are behavioural and/or geographical clusters
rather than an evenly distributed population/behaviour. |
|
|
|
| I choose
the values a bit extreme to get the idea across |
|
|
| 32
clusters with differend spread probabilities, but overall all persons will
spread to others 0.8 in average |
|
| population: |
80,000,000 |
|
devide: |
50 |
50 |
|
depth: |
2 |
|
days: |
15 |
|
|
|
|
| after 300
days we are at 12,000,000 as some clusters explode while others remain muted |
|
| 12,000,000
vs. 5 (just 5, not 5 millions) - that is something different |
|
| ->
this simplified approach does not take into account leakage of spread from
one cluster to another. this would modify the result a little but not in
principle. |
|
| ->
do not mistake this value for the R0 value you would calculate in
retrospective. In retrospective of course you would calculate a different R0
than the spread probability for each person we went into this simulation
here. But this is not the point. |
|
|
|
| let's
explain the effect at a simple example: |
|
| imagine 2
person groups with an average R of 1. |
|
| If both
infection chains spread equally with an R=1, in the 4th generation you get |
|
| 1+1*1+1*1*1+1*1*1*1
= 4 infected persons * 2 persons = 8 infected persons |
|
| now think
of one group/chain spreading to 1.5 persons in average, the other spreading
to 0.5 persons in average, if they become infected. |
|
| overall you
go into that calculation again with an average R of 1 |
|
| but the
result willl be different: |
|
| 1+1*1.5+1*1.5*1.5+1*1.5*1.5*1.5
= 8.125 infected persons for one cluster |
|
| 1+1*0.5+1*0.5*0.5+1*0.5*0.5*0.5
= 1.875 infected persons for the second cluster cluster |
|
| = 10
infected persons in total |
|
|
|
| naturally
the retrospective calculation of an R value would give different resulting
values for R, depending on the method this even changes over generations. |
|
|
|
|
|
|
|
|
|
| the
reason is that in the calculation only the persons are considered that are
actually spreading, and the cluster that is more active grows in the number
of persons faster. |
|
|
|
| |
|
|
|
|
|
|
|
|
|
| this is
just an abstract model which is not much closer to reality than others. But
it could show you how the wrong fit of details can completely flip a
scenario. |
|
| Especially
if you build on averages and aggregations of disparities. |
|
| And we do
a lot here: even a countries official numbers are averages/aggregations of
hot spot clusters and low crisis clusters with high potentials etc. |
|
|
|
|
|
| please
review! |
|
|
|
|
|
|
|
|
|
|
|
|
|
|
|
|
|
|
|
|
|
|
|
|
|