 |
||
 |
 |
||
which is wrong… it is better to call it diagnosed cases or confirmed cases
In the end this is also an indicator of the degree of inconsistency in the original data.
 |
||
(mean [95% credible interval])
(fr. ECDC data)
infected
Mar 28
 |
|||
 |
|||
 |
 |
| This is a component of the ad hoc covid19 data project connected to the FUFF platform (fuff.org) | |||||||||||||||||||||||||||||||||||||||||||
| http://fuff.org/data/cr0.html | |||||||||||||||||||||||||||||||||||||||||||
| At the bottom of this page are tabs. Click there for individual countries. | |||||||||||||||||||||||||||||||||||||||||||
| because there are so many you might have to scroll with the lower scroll bar to the right. | |||||||||||||||||||||||||||||||||||||||||||
| important: if you come back for updated versions, sometimes you will have to refresh every single page!! sorry |
|
||||||||||||||||||||||||||||||||||||||||||
| data source: ECDC | |||||||||||||||||||||||||||||||||||||||||||
| scope: (All) / Switzerland | |||||||||||||||||||||||||||||||||||||||||||
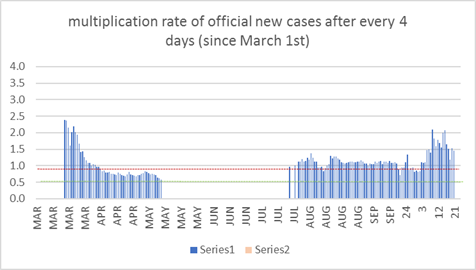
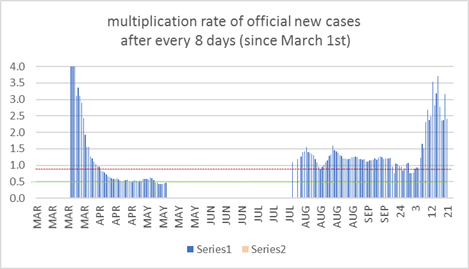
| the most important thing to watch for me at the moment is the multiplication factor | |||||||||||||||||||||||||||||||||||||||||||
| it indicates the direction of the crisis | |||||||||||||||||||||||||||||||||||||||||||
| I have chosen to monitor the multiplaction rate over every 4 days and every 8 days | |||||||||||||||||||||||||||||||||||||||||||
| to eliminate artefacts and daily variance and allow for reliable trends I work with a 7 day average instead of the pure daily data | |||||||||||||||||||||||||||||||||||||||||||
| this means that real trend changes are detected a little later, but that the multitude of false trend changes and data artefacts are surpressed | |||||||||||||||||||||||||||||||||||||||||||
| the numbers for today are: | 1.5 | (4 days) | 2.4 | (8 days) | |||||||||||||||||||||||||||||||||||||||
| this means that there are 1.5 (2.4) times as many new reported cases as 4 (8) days before. | *this chart is explained below. | ||||||||||||||||||||||||||||||||||||||||||
| -> the 7 day average is used here. The actual number for days has too much statistical variance and is inconsistent because of data reporting methodologies. | |||||||||||||||||||||||||||||||||||||||||||
| -> this monitors the new cases for the day. Not the aggregate total. | |||||||||||||||||||||||||||||||||||||||||||
| -> these are officially confirmed diagnosed cases. These do NOT INCLUDE actual cases that are not diagnosed... | |||||||||||||||||||||||||||||||||||||||||||
| …and these do NOT INCLUDE the already infected that will become diagnosed soon, and NOT the infected that will not be discovered because they have low or no symptoms! | |||||||||||||||||||||||||||||||||||||||||||
| -> these are not necessarily cases that happened to occur on that day. Authorities collect data from various sources and they stem from a stretch of days befor the the publication. All data sources have this problem. | |||||||||||||||||||||||||||||||||||||||||||
| These values need to be drastically below 1! (*as shown in the panel simulation -> http://fuff.org/data/cr0.html) | |||||||||||||||||||||||||||||||||||||||||||
| why drastically? Because this is only an average over regions with hot spots and areas with yet low impact but high potentials. It is elementary to understand this risk! | |||||||||||||||||||||||||||||||||||||||||||
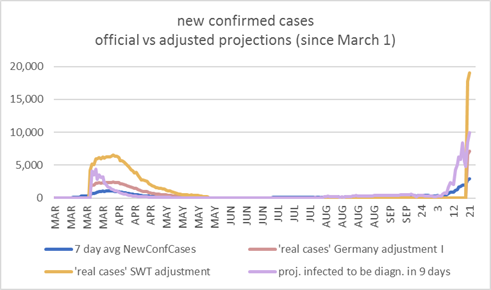
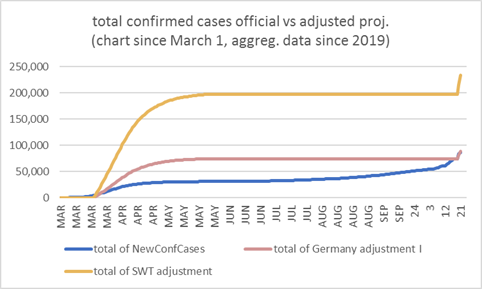
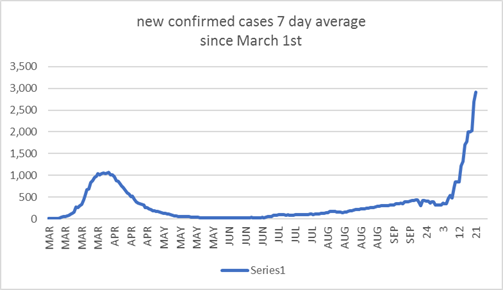
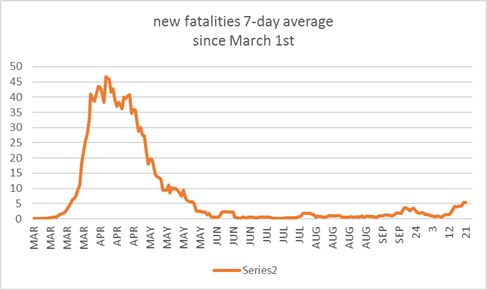
| Here is the development chart since March 1 (blue confirmed cases, the other color fatalities) | |||||||||||||||||||||||||||||||||||||||||||
|
|||||||||||||||||||||||||||||||||||||||||||
| But what are the real numbers? | -> please click on the about tab and read some explanations! | ||||||||||||||||||||||||||||||||||||||||||
| lets experiment with some projections: | |||||||||||||||||||||||||||||||||||||||||||
| first a comparison of daily new cases as officially reported vs. daily new cases adjusted and normed to 1) the numbers of Germany as of March 31 and 2) the numbers of a collection of small wealthy and (hopefully) thoroughly testing countries (must read 'about' tab for explanation!) | |||||||||||||||||||||||||||||||||||||||||||
| the data says: new cases for date: | 20201021 | 3,008 | -> In
news this often is wrongly referred to as the 'number of infected
people' which is wrong… it is better to call it diagnosed cases or confirmed cases |
||||||||||||||||||||||||||||||||||||||||
| method 1 (adjusted to Germany March CFR): | 7,157 | ->
there is a huge difference between methods. We will have to live with a huge
margin of error here. The new Imperial college study (see about tab)
recognizes this, too. The data is just very 'dirty' and inconsistent to begin
with. In the end this is also an indicator of the degree of inconsistency in the original data. |
|||||||||||||||||||||||||||||||||||||||||
| method 2 (adjusted to May SWT CFR): | 19,019 | ||||||||||||||||||||||||||||||||||||||||||
|
|
|
||||||||||||||||||||||||||||||||||||||||||
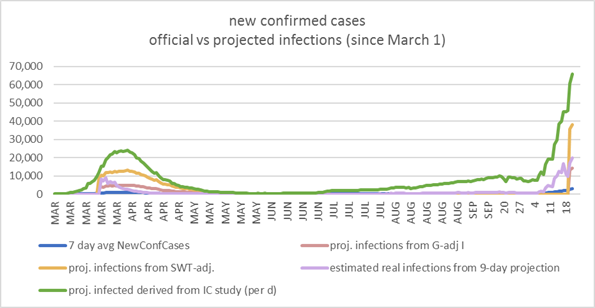
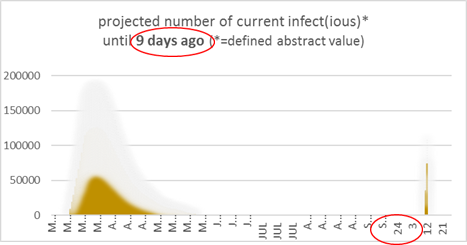
| in the charts above there is another graph, for 'proj. infected to be diagn. in 9 days'. What is this? | |||||||||||||||||||||||||||||||||||||||||||
| -> before a case gets diagnosed and officially counted, the person has been already infected several days | |||||||||||||||||||||||||||||||||||||||||||
| Now - if for example the time for infected people is 9 days until they become diagnosed (estimations), and consider the multiplication rate of the 7 day average in that span | |||||||||||||||||||||||||||||||||||||||||||
| we will calculate a number that is 3.3 times as high | |||||||||||||||||||||||||||||||||||||||||||
| in this case that number would be | 10,003 | (*calculated from the 7 day average. It is a better base for this purpose.) | |||||||||||||||||||||||||||||||||||||||||
| -> according to this projection, this number of people, about 10003, will become diagnosed as new cases in 9 days. Not until then. That day alone. | |||||||||||||||||||||||||||||||||||||||||||
| -> please note that this number can not be influenced by measures anymore. However it can be imprecise, even by a wide margin. See explanations below | |||||||||||||||||||||||||||||||||||||||||||
| -> indicator: the difference of the 7 day average of official cases (column D) with the projected value 9 days ago signals the change of trajection. see momentum below | |||||||||||||||||||||||||||||||||||||||||||
| -> the variance of this value tells us how imprecise these calculations can be and/or how flawed some data probably is! (if you want to know how flawed the data is, just compare the numbers for diagnosed vs fatalities in Germany and UK on day 20200328) | |||||||||||||||||||||||||||||||||||||||||||
| -> observed artefacts: 1st phase: cases are not recognised as the virus (flu and pneumonia instead) and are missing in the numbers. | |||||||||||||||||||||||||||||||||||||||||||
| -> 2nd phase: now they are -> a higher acceleration rate is observed, than present in reality, because projections from phase 1 were too low | |||||||||||||||||||||||||||||||||||||||||||
| -> now the opposite effect: projections for phase 3 are too high. you see this as an artefact hump in some charts. (this hump might actually assist us to estimate the 'real' beginning of spread of cases in a country). | |||||||||||||||||||||||||||||||||||||||||||
| -> phase 3: 2 new effects add: interventions flatten the curve. Another effect might add, too: hot spots are overwhelmed and unable to diagnose all cases (see Italy) | |||||||||||||||||||||||||||||||||||||||||||
| -> phase 4: the 9 day projection line (purple) crosses the confirmed cases line (blue) from above. This is actually a good sign, however that needs to be sustained. | |||||||||||||||||||||||||||||||||||||||||||
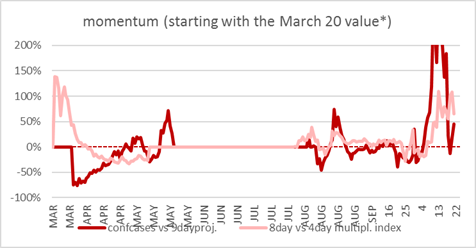
| the momentum | |||||||||||||||||||||||||||||||||||||||||||
| Two variations to calculate a momentum indicator. | |||||||||||||||||||||||||||||||||||||||||||
| the red line is calculated from the difference of the 7 day average of official cases (column D) with the projected value 9 days ago. | |||||||||||||||||||||||||||||||||||||||||||
| * -> However, while this is a value for todays confirmed cases, to be consistent with our conclusions above, we have to assume that, in the context of infections, this value refers to the situation 9 days ago. | |||||||||||||||||||||||||||||||||||||||||||
| the value might be a bit challenging to understand: it tells us about trends, accelerations and reversals. positive values for more cases than expected, negative for less cases than expected. | |||||||||||||||||||||||||||||||||||||||||||
| examples: if the exponential growth accelerates we have a positive momentum value, if it slows down, it is negative. if a trend is established, a momentum of 0 means the trend is maintained. In the phase of successful containment it is ok to eventually have a value of 0, but it would be much better not to get into plus territory. However China apparently has been managing to control short phases of plus values, too. | |||||||||||||||||||||||||||||||||||||||||||
| the pink line is calculated from the difference of the 8 day index and the 4 day index for confirmed cases. It is rather a slow lagging behind indicator and less sensitive to trend changes. | |||||||||||||||||||||||||||||||||||||||||||
|
|
|||||||||||||||||||||||||||||||||||||||||||
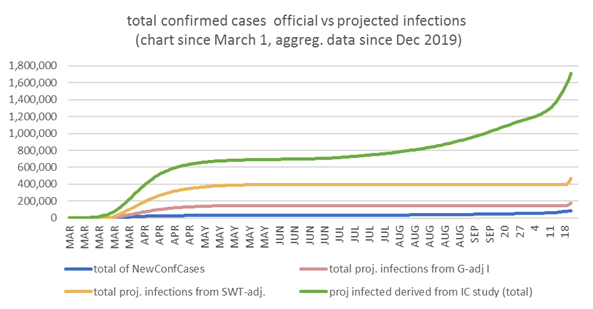
| cases are not infections - what about total infections? | |||||||||||||||||||||||||||||||||||||||||||
| so yes, there is more | |||||||||||||||||||||||||||||||||||||||||||
| -> there is a huge number of infections that will not become diagnosed, usually because they have no or mild symptoms | |||||||||||||||||||||||||||||||||||||||||||
| it is estimated to be something in the area of 50% of the actual infections. However this remains a very imprecise value for now. And the detection rate might be very different from country to country. | |||||||||||||||||||||||||||||||||||||||||||
| so, by thumb, the real number of new infections today could be as high as | 20,006 | ||||||||||||||||||||||||||||||||||||||||||
| -> this hidden number, 9 days from now, would be as high as 66529 then, though only if the situation (lockdowns, tests etc) has not recently changed and remains unchanged. | |||||||||||||||||||||||||||||||||||||||||||
| total infections - a different approach: the Imperial College study projection | |||||||||||||||||||||||||||||||||||||||||||
| a study published March 30 projected infection numbers for March 28 for a handful of European states | |||||||||||||||||||||||||||||||||||||||||||
| method: https://www.imperial.ac.uk/media/imperial-college/medicine/sph/ide/gida-fellowships/Imperial-College-COVID19-Europe-estimates-and-NPI-impact-30-03-2020.pdf | |||||||||||||||||||||||||||||||||||||||||||
| Country% of total
population infected (mean [95% credible interval]) |
population (fr. ECDC data) |
possibly infected Mar 28 |
|||||||||||||||||||||||||||||||||||||||||
| Austria | 1.10% | [0.36%-3.1%] | 8847037 | 97317 | |||||||||||||||||||||||||||||||||||||||
| Belgium | 3.70% | [1.3%-9.7%] | 11422068 | 422617 | |||||||||||||||||||||||||||||||||||||||
| Denmark | 1.10% | [0.40%-3.1%] | 5797446 | 63772 | |||||||||||||||||||||||||||||||||||||||
| France | 3.00% | [1.1%-7.4%] | 66987244 | 2009617 | |||||||||||||||||||||||||||||||||||||||
| Germany | 0.72% | [0.28%-1.8%] | 82927922 | 597081 | |||||||||||||||||||||||||||||||||||||||
| Italy | 9.80% | [3.2%-26%] | 60431283 | 5922266 | |||||||||||||||||||||||||||||||||||||||
| Norway | 0.41% | [0.09%-1.2%] | 5314336 | 21789 | |||||||||||||||||||||||||||||||||||||||
| Spain | 15% | [3.7%-41%] | 46723749 | 7008562 | |||||||||||||||||||||||||||||||||||||||
| Sweden | 3.10% | [0.85%-8.4%] | 10183175 | 315678 | |||||||||||||||||||||||||||||||||||||||
| Switzerland | 3.20% | [1.3%-7.6%] | 8516543 | 272529 | |||||||||||||||||||||||||||||||||||||||
| United_Kingdom | 2.70% | [1.2%-5.4] | 66488991 | 1795203 | |||||||||||||||||||||||||||||||||||||||
| quick fix: we can project from the other available parameters our number for the other days. | |||||||||||||||||||||||||||||||||||||||||||
| -> this however means: only March 28 is the correct value from the Imperial College method, the rest might derive to a degree which is difficult to determine | |||||||||||||||||||||||||||||||||||||||||||
| so completing the charts with these projections: | |||||||||||||||||||||||||||||||||||||||||||
| (projections derived from imperial college study (green line) is only available for above mentioned countries) | |||||||||||||||||||||||||||||||||||||||||||
|
|||||||||||||||||||||||||||||||||||||||||||
| But how many are actually potentially infected/infectious at this moment? | |||||||||||||||||||||||||||||||||||||||||||
| so far we have seen daily new and total, but how many are actually infectious at this moment? | |||||||||||||||||||||||||||||||||||||||||||
| Here we get even more in fuzzy territory. And what are we talking of? Containing the virus? Spreading the virus? Not yet in hospital? Not yet completely healed? | |||||||||||||||||||||||||||||||||||||||||||
| The formal way is to deduct the 'recovered' and 'fatalities' data from 'total infections'. But this throws up new problems. | |||||||||||||||||||||||||||||||||||||||||||
| First we would have to rely on even more inconsistent data, second on a different data sources (JHS) with data that is not consistent to ECDC in several details (see about flawed raw data tab) | |||||||||||||||||||||||||||||||||||||||||||
| And most importantly we would add another speculation about the infected but not cases number which is inconsistent again between countries and within countries. | |||||||||||||||||||||||||||||||||||||||||||
| So I decided to make some neutral definition here, which may not fully represent the answer to the original question but hopefully still gives us an approximate value of some quality. | |||||||||||||||||||||||||||||||||||||||||||
| Unfortunately the 9 day projection has proven as oversensitive to different phases of underreporting and data dvelopment. So it can not be used here. | |||||||||||||||||||||||||||||||||||||||||||
| This is why I take a more conservative approach and do not even project that number for today but for 9 days ago | |||||||||||||||||||||||||||||||||||||||||||
| We use the SWT-Projection method here, as this one appears to be the most precise and the best applicable for different countries. | |||||||||||||||||||||||||||||||||||||||||||
| However there will be still variant differences in the accuracy for different countries, as demograhic, healthcare, timeline and even meteorological scenarios affect fatality rates to some extent. | |||||||||||||||||||||||||||||||||||||||||||
| (We define an abstract infect-period as 10 days) | |||||||||||||||||||||||||||||||||||||||||||
|
|
|||||||||||||||||||||||||||||||||||||||||||
| now wait, please take time for important disclaimers: | |||||||||||||||||||||||||||||||||||||||||||
| 1. we are working with average numbers here instead of complicated distribution models. this is a bigger deal than you might think. | |||||||||||||||||||||||||||||||||||||||||||
| -> even the raw data does within a country mix data from non comparable situations. the trouble begins here | |||||||||||||||||||||||||||||||||||||||||||
| 2. we have highly differing circumstances and data reporting in different countries, which influence the actual results heavily | |||||||||||||||||||||||||||||||||||||||||||
| 3. interventions and change of behaviour chane the course away from timeline projections | |||||||||||||||||||||||||||||||||||||||||||
| -> so these projection are to help understand how basic mechanisms and trends work here, they can not to prognost exact numbers. It is just not in the data. | |||||||||||||||||||||||||||||||||||||||||||
| -> the actual results are very unsharp. for better results we need more circumstancial and consistent data and more sophisticated understanding! | |||||||||||||||||||||||||||||||||||||||||||
| This is not a basketball game, where some instance or even everybody is counting the exact number of scores. If our actual basketball score is 99:97, we here have a data that says 25:38 instead. | |||||||||||||||||||||||||||||||||||||||||||
| -> if anything they are telling the story of how terrible the reported data is informing us. | |||||||||||||||||||||||||||||||||||||||||||
| Still, even if the data is highly inaccurate and not very consistent in itself, there is still some degree of consistency within. | |||||||||||||||||||||||||||||||||||||||||||
| And some information, and you can draw some conclusions from it. But you need to know it well and be very cautious and restrained. | |||||||||||||||||||||||||||||||||||||||||||
| now on to the fatalaty rate | |||||||||||||||||||||||||||||||||||||||||||
| -> the right thing to determine the fatality rate would be to consider only closed cases. But I do not have the numbers and we would need to wait for cases to be closed. So the data would be too old for monitoring actual developments. | |||||||||||||||||||||||||||||||||||||||||||
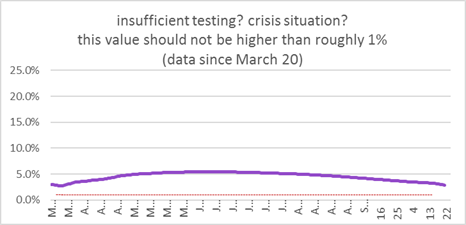
| here our value (column H) might be irritating as it does not reflect official numbers | |||||||||||||||||||||||||||||||||||||||||||
| I have far higher value than is reported everywhere | 2.9% | ||||||||||||||||||||||||||||||||||||||||||
| However one should take into account (a) the estimated 50% unreported infections, and (b) depending on the country, other parameters | |||||||||||||||||||||||||||||||||||||||||||
| so it would be rather (very fuzzy!) | 1.5% | ||||||||||||||||||||||||||||||||||||||||||
| this value differs much from country to country, for example the differnece in numbers from Germany and Italy make it very hard to calculate with that | |||||||||||||||||||||||||||||||||||||||||||
| It might be still higher than "official" numbers. The reason could be my way of calculation: | |||||||||||||||||||||||||||||||||||||||||||
| I calculated this number as follows: Again I used 7 day averages | |||||||||||||||||||||||||||||||||||||||||||
| I divided the number of fatalities up to the actual day through the number of cases up to 6 days back(!) | |||||||||||||||||||||||||||||||||||||||||||
| Which is the assumed average time between diagnosis and fatal outcome in this modelling. You can not compare it to a number which includes a huge number of new open cases. | |||||||||||||||||||||||||||||||||||||||||||
| * -> here I ran into a data dilemma. After studies this value should be even higher, but I found that to bizarrly exeggerate the fatality rate and contradicting to data consistency. However this has to be examined!! | |||||||||||||||||||||||||||||||||||||||||||
| The highly different numbers (example: Germany and taly) tell us something about testing and crisis state of the health system. | |||||||||||||||||||||||||||||||||||||||||||
| However you cannot exactly draw calculations from that, as it is difficult to detect which of the two factor in to what extent. | |||||||||||||||||||||||||||||||||||||||||||
| Again: using average and/or aggregated values instead of complicated models blurs everything further. The purpose is to demonstrate mechanisms and provide a template for an improved model. | |||||||||||||||||||||||||||||||||||||||||||
| (However complicated models have the disadvantage that a detail can tip the whole model into the wrong direction. That is why so many models evntually fail. Also google for Talib and fat tail risk.) | |||||||||||||||||||||||||||||||||||||||||||
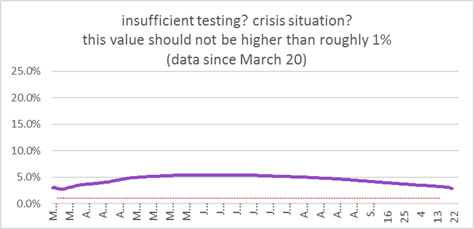
| In the tab 'focus' you find a 'testing/crisis indicator'. this is just a quick test which neglects the time lag between diagnosis and fatalities. | |||||||||||||||||||||||||||||||||||||||||||
| It only serves to have a quick look at countries not in the tabs. | |||||||||||||||||||||||||||||||||||||||||||
| Here we better refer to the above defined fatality rate value. Don't get confused as this value is reversed compared to what you see in 'focus'. Here lower is better. | |||||||||||||||||||||||||||||||||||||||||||
|
|
|||||||||||||||||||||||||||||||||||||||||||
| ` | |||||||||||||||||||||||||||||||||||||||||||
| -> there still can be artefacts from the data consistency or the low value for time lag between diagnosis/fatality | |||||||||||||||||||||||||||||||||||||||||||
| -> This value does not tell us about the infection scenario, they a result of the infection scenario roughly 14 days ago. So this is not a good basis for decisions. | |||||||||||||||||||||||||||||||||||||||||||
| -> Aggregated values (world level, country level) conceal real bad situations in crisis hot spots | |||||||||||||||||||||||||||||||||||||||||||
| Below you find the actual calculations: | |||||||||||||||||||||||||||||||||||||||||||
| average over… | days for index | days for index 2 | min cases for projections | days diagn:fat for pct | days until diag | Germany adj. rate | SWT adj. rate | max | min | estimated low symptom untested | est. infections Imperial C. Study M30 (if avail.) | infectious period | |||||||||||||||||||||||||||||||
| tag1 | (All) | 7 | 4 | 8 | 100 | 6 | 9 | 1.32% | 0.49% | 0.03 | 0.008 | 50.00% | 272529 | 10 | |||||||||||||||||||||||||||||
| CountryExp | Switzerland | (to curbe nonrelevant artefacts) | official M28: | ||||||||||||||||||||||||||||||||||||||||
| 12104 | |||||||||||||||||||||||||||||||||||||||||||
| Row Labels | Sum of NewConfCases | Sum of NewDeaths | 7 day avg NewConfCases | index/multipl. rate over 4 days | index/multipl. rate over 8 days | 100 day avg NewFatalities | index/multipl. rate over 4 days | index/multipl. rate over 8 days | fatality rate | fatality rate (avg) | crisis indicator | 'real cases' Germany adjustment I | 'real cases' SWT adjustment | proj. infected to be diagn. in 9 days | momentum | total of NewConfCases | total of Germany adjustment I | total of SWT adjustment | estimated real infections from 9-day projection | total of proj inf. (9-d) | total from estimated real infections 9-d proj. | proj infected derived from IC study (total) | proj. infected derived from IC study (per d) | proj. infections from G-adj I | proj. infections from SWT-adj. | total proj. infections from G-adj I | total proj. infections from SWT-adj. | day # (for charts) | date in date format | infect proj. from proj. inf. G-adj I | momentum II | ||||||||||||
| 20191231 | 0 | 0 | 0 | 0 | 0 | 0 | 0 | 0 | 0 | 0 | 0 | 0 | 0 | DEC | 12/31/2019 | #DIV/0! | |||||||||||||||||||||||||||
| 20200101 | 0 | 0 | 0 | 0 | 0.0% | #VALUE! | #VALUE! | 0 | 0 | 0 | #VALUE! | #VALUE! | 0 | 0 | 0 | #VALUE! | #VALUE! | 0 | 0 | JAN | 1/1/2020 | #VALUE! | |||||||||||||||||||||
| 20200102 | 0 | 0 | 0 | 0 | 0.0% | #VALUE! | #VALUE! | 0 | 0 | 0 | #VALUE! | #VALUE! | 0 | 0 | 0 | #VALUE! | #VALUE! | 0 | 0 | JAN | 1/2/2020 | #VALUE! | |||||||||||||||||||||
| 20200103 | 0 | 0 | 0 | 0 | #DIV/0! | #VALUE! | #VALUE! | 0 | 0 | 0 | #VALUE! | #VALUE! | 0 | 0 | 0 | #VALUE! | #VALUE! | 0 | 0 | JAN | 1/3/2020 | #VALUE! | |||||||||||||||||||||
| 20200104 | 0 | 0 | 0 | 0 | #DIV/0! | #VALUE! | #VALUE! | 0 | 0 | 0 | #VALUE! | #VALUE! | 0 | 0 | 0 | #VALUE! | #VALUE! | 0 | 0 | JAN | 1/4/2020 | #VALUE! | |||||||||||||||||||||
| 20200105 | 0 | 0 | 0 | 0 | #DIV/0! | #VALUE! | #VALUE! | 0 | 0 | 0 | #VALUE! | #VALUE! | 0 | 0 | 0 | #VALUE! | #VALUE! | 0 | 0 | JAN | 1/5/2020 | #VALUE! | |||||||||||||||||||||
| 20200106 | 0 | 0 | 0 | 0 | #DIV/0! | #VALUE! | #VALUE! | 0 | 0 | 0 | #VALUE! | #VALUE! | 0 | 0 | 0 | #VALUE! | #VALUE! | 0 | 0 | JAN | 1/6/2020 | #VALUE! | |||||||||||||||||||||
| 20200107 | 0 | 0 | 0 | 0 | #DIV/0! | #VALUE! | #VALUE! | 0 | 0 | 0 | #VALUE! | #VALUE! | 0 | 0 | 0 | #VALUE! | #VALUE! | 0 | 0 | JAN | 1/7/2020 | #VALUE! | |||||||||||||||||||||
| 20200108 | 0 | 0 | 0 | 0 | #DIV/0! | #VALUE! | #VALUE! | 0 | 0 | 0 | #VALUE! | #VALUE! | 0 | 0 | 0 | #VALUE! | #VALUE! | 0 | 0 | JAN | 1/8/2020 | #VALUE! | |||||||||||||||||||||
| 20200109 | 0 | 0 | 0 | 0 | #DIV/0! | #VALUE! | #VALUE! | 0 | 0 | 0 | #VALUE! | #VALUE! | 0 | 0 | 0 | #VALUE! | #VALUE! | 0 | 0 | JAN | 1/9/2020 | #VALUE! | |||||||||||||||||||||
| 20200110 | 0 | 0 | 0 | 0 | #DIV/0! | #VALUE! | #VALUE! | 0 | 0 | 0 | #VALUE! | #VALUE! | 0 | 0 | 0 | #VALUE! | #VALUE! | 0 | 0 | JAN | 1/10/2020 | #VALUE! | |||||||||||||||||||||
| 20200111 | 0 | 0 | 0 | 0 | #DIV/0! | #VALUE! | #VALUE! | 0 | 0 | 0 | #VALUE! | #VALUE! | 0 | 0 | 0 | #VALUE! | #VALUE! | 0 | 0 | JAN | 1/11/2020 | #VALUE! | |||||||||||||||||||||
| 20200112 | 0 | 0 | 0 | 0 | #DIV/0! | #VALUE! | #VALUE! | 0 | 0 | 0 | #VALUE! | #VALUE! | 0 | 0 | 0 | #VALUE! | #VALUE! | 0 | 0 | JAN | 1/12/2020 | #VALUE! | |||||||||||||||||||||
| 20200113 | 0 | 0 | 0 | 0 | #DIV/0! | #VALUE! | #VALUE! | 0 | 0 | 0 | #VALUE! | #VALUE! | 0 | 0 | 0 | #VALUE! | #VALUE! | 0 | 0 | JAN | 1/13/2020 | #VALUE! | |||||||||||||||||||||
| 20200114 | 0 | 0 | 0 | 0 | #DIV/0! | #VALUE! | #VALUE! | 0 | 0 | 0 | #VALUE! | #VALUE! | 0 | 0 | 0 | #VALUE! | #VALUE! | 0 | 0 | JAN | 1/14/2020 | #VALUE! | |||||||||||||||||||||
| 20200115 | 0 | 0 | 0 | 0 | #DIV/0! | #VALUE! | #VALUE! | 0 | 0 | 0 | #VALUE! | #VALUE! | 0 | 0 | 0 | #VALUE! | #VALUE! | 0 | 0 | JAN | 1/15/2020 | #VALUE! | |||||||||||||||||||||
| 20200116 | 0 | 0 | 0 | 0 | #DIV/0! | #VALUE! | #VALUE! | 0 | 0 | 0 | #VALUE! | #VALUE! | 0 | 0 | 0 | #VALUE! | #VALUE! | 0 | 0 | JAN | 1/16/2020 | #VALUE! | |||||||||||||||||||||
| 20200117 | 0 | 0 | 0 | 0 | #DIV/0! | #VALUE! | #VALUE! | 0 | 0 | 0 | #VALUE! | #VALUE! | 0 | 0 | 0 | #VALUE! | #VALUE! | 0 | 0 | JAN | 1/17/2020 | #VALUE! | |||||||||||||||||||||
| 20200118 | 0 | 0 | 0 | 0 | #DIV/0! | #VALUE! | #VALUE! | 0 | 0 | 0 | #VALUE! | #VALUE! | 0 | 0 | 0 | #VALUE! | #VALUE! | 0 | 0 | JAN | 1/18/2020 | #VALUE! | |||||||||||||||||||||
| 20200119 | 0 | 0 | 0 | 0 | #DIV/0! | #VALUE! | #VALUE! | 0 | 0 | 0 | #VALUE! | #VALUE! | 0 | 0 | 0 | #VALUE! | #VALUE! | 0 | 0 | JAN | 1/19/2020 | #VALUE! | |||||||||||||||||||||
| 20200120 | 0 | 0 | 0 | 0 | #DIV/0! | #VALUE! | #VALUE! | 0 | 0 | 0 | #VALUE! | #VALUE! | 0 | 0 | 0 | #VALUE! | #VALUE! | 0 | 0 | JAN | 1/20/2020 | #VALUE! | |||||||||||||||||||||
| 20200121 | 0 | 0 | 0 | 0 | #DIV/0! | #VALUE! | #VALUE! | 0 | 0 | 0 | #VALUE! | #VALUE! | 0 | 0 | 0 | #VALUE! | #VALUE! | 0 | 0 | JAN | 1/21/2020 | #VALUE! | |||||||||||||||||||||
| 20200122 | 0 | 0 | 0 | 0 | #DIV/0! | #VALUE! | #VALUE! | 0 | 0 | 0 | #VALUE! | #VALUE! | 0 | 0 | 0 | #VALUE! | #VALUE! | 0 | 0 | JAN | 1/22/2020 | #VALUE! | |||||||||||||||||||||
| 20200123 | 0 | 0 | 0 | 0 | #DIV/0! | #VALUE! | #VALUE! | 0 | 0 | 0 | #VALUE! | #VALUE! | 0 | 0 | 0 | #VALUE! | #VALUE! | 0 | 0 | JAN | 1/23/2020 | #VALUE! | |||||||||||||||||||||
| 20200124 | 0 | 0 | 0 | 0 | #DIV/0! | #VALUE! | #VALUE! | 0 | 0 | 0 | #VALUE! | #VALUE! | 0 | 0 | 0 | #VALUE! | #VALUE! | 0 | 0 | JAN | 1/24/2020 | #VALUE! | |||||||||||||||||||||
| 20200125 | 0 | 0 | 0 | 0 | #DIV/0! | #VALUE! | #VALUE! | 0 | 0 | 0 | #VALUE! | #VALUE! | 0 | 0 | 0 | #VALUE! | #VALUE! | 0 | 0 | JAN | 1/25/2020 | #VALUE! | |||||||||||||||||||||
| 20200126 | 0 | 0 | 0 | 0 | #DIV/0! | #VALUE! | #VALUE! | 0 | 0 | 0 | #VALUE! | #VALUE! | 0 | 0 | 0 | #VALUE! | #VALUE! | 0 | 0 | JAN | 1/26/2020 | #VALUE! | |||||||||||||||||||||
| 20200127 | 0 | 0 | 0 | 0 | #DIV/0! | #VALUE! | #VALUE! | 0 | 0 | 0 | #VALUE! | #VALUE! | 0 | 0 | 0 | #VALUE! | #VALUE! | 0 | 0 | JAN | 1/27/2020 | #VALUE! | |||||||||||||||||||||
| 20200128 | 0 | 0 | 0 | 0 | #DIV/0! | #VALUE! | #VALUE! | 0 | 0 | 0 | #VALUE! | #VALUE! | 0 | 0 | 0 | #VALUE! | #VALUE! | 0 | 0 | JAN | 1/28/2020 | #VALUE! | |||||||||||||||||||||
| 20200129 | 0 | 0 | 0 | 0 | #DIV/0! | #VALUE! | #VALUE! | 0 | 0 | 0 | #VALUE! | #VALUE! | 0 | 0 | 0 | #VALUE! | #VALUE! | 0 | 0 | JAN | 1/29/2020 | #VALUE! | |||||||||||||||||||||
| 20200130 | 0 | 0 | 0 | 0 | #DIV/0! | #VALUE! | #VALUE! | 0 | 0 | 0 | #VALUE! | #VALUE! | 0 | 0 | 0 | #VALUE! | #VALUE! | 0 | 0 | JAN | 1/30/2020 | #VALUE! | |||||||||||||||||||||
| 20200131 | 0 | 0 | 0 | 0 | #DIV/0! | #VALUE! | #VALUE! | 0 | 0 | 0 | #VALUE! | #VALUE! | 0 | 0 | 0 | #VALUE! | #VALUE! | 0 | 0 | JAN | 1/31/2020 | #VALUE! | |||||||||||||||||||||
| 20200201 | 0 | 0 | 0 | 0 | #DIV/0! | #VALUE! | #VALUE! | 0 | 0 | 0 | #VALUE! | #VALUE! | 0 | 0 | 0 | #VALUE! | #VALUE! | 0 | 0 | FEB | 2/1/2020 | #VALUE! | |||||||||||||||||||||
| 20200202 | 0 | 0 | 0 | 0 | #DIV/0! | #VALUE! | #VALUE! | 0 | 0 | 0 | #VALUE! | #VALUE! | 0 | 0 | 0 | #VALUE! | #VALUE! | 0 | 0 | FEB | 2/2/2020 | #VALUE! | |||||||||||||||||||||
| 20200203 | 0 | 0 | 0 | 0 | #DIV/0! | #VALUE! | #VALUE! | 0 | 0 | 0 | #VALUE! | #VALUE! | 0 | 0 | 0 | #VALUE! | #VALUE! | 0 | 0 | FEB | 2/3/2020 | #VALUE! | |||||||||||||||||||||
| 20200204 | 0 | 0 | 0 | 0 | #DIV/0! | #VALUE! | #VALUE! | 0 | 0 | 0 | #VALUE! | #VALUE! | 0 | 0 | 0 | #VALUE! | #VALUE! | 0 | 0 | FEB | 2/4/2020 | #VALUE! | |||||||||||||||||||||
| 20200205 | 0 | 0 | 0 | 0 | #DIV/0! | #VALUE! | #VALUE! | 0 | 0 | 0 | #VALUE! | #VALUE! | 0 | 0 | 0 | #VALUE! | #VALUE! | 0 | 0 | FEB | 2/5/2020 | #VALUE! | |||||||||||||||||||||
| 20200206 | 0 | 0 | 0 | 0 | #DIV/0! | #VALUE! | #VALUE! | 0 | 0 | 0 | #VALUE! | #VALUE! | 0 | 0 | 0 | #VALUE! | #VALUE! | 0 | 0 | FEB | 2/6/2020 | #VALUE! | |||||||||||||||||||||
| 20200207 | 0 | 0 | 0 | 0 | #DIV/0! | #VALUE! | #VALUE! | 0 | 0 | 0 | #VALUE! | #VALUE! | 0 | 0 | 0 | #VALUE! | #VALUE! | 0 | 0 | FEB | 2/7/2020 | #VALUE! | |||||||||||||||||||||
| 20200208 | 0 | 0 | 0 | 0 | #DIV/0! | #VALUE! | #VALUE! | 0 | 0 | 0 | #VALUE! | #VALUE! | 0 | 0 | 0 | #VALUE! | #VALUE! | 0 | 0 | FEB | 2/8/2020 | #VALUE! | |||||||||||||||||||||
| 20200209 | 0 | 0 | 0 | 0 | #DIV/0! | #VALUE! | #VALUE! | 0 | 0 | 0 | #VALUE! | #VALUE! | 0 | 0 | 0 | #VALUE! | #VALUE! | 0 | 0 | FEB | 2/9/2020 | #VALUE! | |||||||||||||||||||||
| 20200210 | 0 | 0 | 0 | 0 | #DIV/0! | #VALUE! | #VALUE! | 0 | 0 | 0 | #VALUE! | #VALUE! | 0 | 0 | 0 | #VALUE! | #VALUE! | 0 | 0 | FEB | 2/10/2020 | #VALUE! | |||||||||||||||||||||
| 20200211 | 0 | 0 | 0 | 0 | #DIV/0! | #VALUE! | #VALUE! | 0 | 0 | 0 | #VALUE! | #VALUE! | 0 | 0 | 0 | #VALUE! | #VALUE! | 0 | 0 | FEB | 2/11/2020 | #VALUE! | |||||||||||||||||||||
| 20200212 | 0 | 0 | 0 | 0 | #DIV/0! | #VALUE! | #VALUE! | 0 | 0 | 0 | #VALUE! | #VALUE! | 0 | 0 | 0 | #VALUE! | #VALUE! | 0 | 0 | FEB | 2/12/2020 | #VALUE! | |||||||||||||||||||||
| 20200213 | 0 | 0 | 0 | 0 | #DIV/0! | #VALUE! | #VALUE! | 0 | 0 | 0 | #VALUE! | #VALUE! | 0 | 0 | 0 | #VALUE! | #VALUE! | 0 | 0 | FEB | 2/13/2020 | #VALUE! | |||||||||||||||||||||
| 20200214 | 0 | 0 | 0 | 0 | #DIV/0! | #VALUE! | #VALUE! | 0 | 0 | 0 | #VALUE! | #VALUE! | 0 | 0 | 0 | #VALUE! | #VALUE! | 0 | 0 | FEB | 2/14/2020 | #VALUE! | |||||||||||||||||||||
| 20200215 | 0 | 0 | 0 | 0 | #DIV/0! | #VALUE! | #VALUE! | 0 | 0 | 0 | #VALUE! | #VALUE! | 0 | 0 | 0 | #VALUE! | #VALUE! | 0 | 0 | FEB | 2/15/2020 | #VALUE! | |||||||||||||||||||||
| 20200216 | 0 | 0 | 0 | 0 | #DIV/0! | #VALUE! | #VALUE! | 0 | 0 | 0 | #VALUE! | #VALUE! | 0 | 0 | 0 | #VALUE! | #VALUE! | 0 | 0 | FEB | 2/16/2020 | #VALUE! | |||||||||||||||||||||
| 20200217 | 0 | 0 | 0 | 0 | #DIV/0! | #VALUE! | #VALUE! | 0 | 0 | 0 | #VALUE! | #VALUE! | 0 | 0 | 0 | #VALUE! | #VALUE! | 0 | 0 | FEB | 2/17/2020 | #VALUE! | |||||||||||||||||||||
| 20200218 | 0 | 0 | 0 | 0 | #DIV/0! | #VALUE! | #VALUE! | 0 | 0 | 0 | #VALUE! | #VALUE! | 0 | 0 | 0 | #VALUE! | #VALUE! | 0 | 0 | FEB | 2/18/2020 | #VALUE! | |||||||||||||||||||||
| 20200219 | 0 | 0 | 0 | 0 | #DIV/0! | #VALUE! | #VALUE! | 0 | 0 | 0 | #VALUE! | #VALUE! | 0 | 0 | 0 | #VALUE! | #VALUE! | 0 | 0 | FEB | 2/19/2020 | #VALUE! | |||||||||||||||||||||
| 20200220 | 0 | 0 | 0 | 0 | #DIV/0! | #VALUE! | #VALUE! | 0 | 0 | 0 | #VALUE! | #VALUE! | 0 | 0 | 0 | #VALUE! | #VALUE! | 0 | 0 | FEB | 2/20/2020 | #VALUE! | |||||||||||||||||||||
| 20200221 | 0 | 0 | 0 | 0 | #DIV/0! | #VALUE! | #VALUE! | 0 | 0 | 0 | #VALUE! | #VALUE! | 0 | 0 | 0 | #VALUE! | #VALUE! | 0 | 0 | FEB | 2/21/2020 | #VALUE! | |||||||||||||||||||||
| 20200222 | 0 | 0 | 0 | 0 | #DIV/0! | #VALUE! | #VALUE! | 0 | 0 | 0 | #VALUE! | #VALUE! | 0 | 0 | 0 | #VALUE! | #VALUE! | 0 | 0 | FEB | 2/22/2020 | #VALUE! | |||||||||||||||||||||
| 20200223 | 0 | 0 | 0 | 0 | #DIV/0! | #VALUE! | #VALUE! | 0 | 0 | 0 | #VALUE! | #VALUE! | 0 | 0 | 0 | #VALUE! | #VALUE! | 0 | 0 | FEB | 2/23/2020 | #VALUE! | |||||||||||||||||||||
| 20200224 | 0 | 0 | 0 | 0 | #DIV/0! | #VALUE! | #VALUE! | 0 | 0 | 0 | #VALUE! | #VALUE! | 0 | 0 | 0 | #VALUE! | #VALUE! | 0 | 0 | FEB | 2/24/2020 | #VALUE! | |||||||||||||||||||||
| 20200225 | 0 | 0 | 0 | 0 | #DIV/0! | #VALUE! | #VALUE! | 0 | 0 | 0 | #VALUE! | #VALUE! | 0 | 0 | 0 | #VALUE! | #VALUE! | 0 | 0 | FEB | 2/25/2020 | #VALUE! | |||||||||||||||||||||
| 20200226 | 1 | 0 | 0 | 0 | #DIV/0! | #VALUE! | #VALUE! | 1 | 0 | 0 | #VALUE! | #VALUE! | 0 | 3 | 3.21652082 | #VALUE! | #VALUE! | 0 | 0 | FEB | 2/26/2020 | #VALUE! | |||||||||||||||||||||
| 20200227 | 0 | 0 | 0 | 0 | #DIV/0! | #VALUE! | #VALUE! | 1 | 0 | 0 | #VALUE! | #VALUE! | 0 | 6 | 3.21652082 | #VALUE! | #VALUE! | 0 | 0 | FEB | 2/27/2020 | #VALUE! | |||||||||||||||||||||
| 20200228 | 7 | 0 | 1 | 0 | #DIV/0! | #VALUE! | #VALUE! | 8 | 0 | 0 | #VALUE! | #VALUE! | 0 | 32 | 25.73216656 | #VALUE! | #VALUE! | 0 | 0 | FEB | 2/28/2020 | #VALUE! | |||||||||||||||||||||
| 20200229 | 4 | 0 | 2 | 0 | #DIV/0! | #VALUE! | #VALUE! | 12 | 0 | 0 | #VALUE! | #VALUE! | 0 | 71 | 38.59824983 | #VALUE! | #VALUE! | 0 | 0 | FEB | 2/29/2020 | #VALUE! | |||||||||||||||||||||
| 20200301 | 6 | 0 | 3 | 0 | #DIV/0! | #VALUE! | #VALUE! | 18 | 0 | 0 | #VALUE! | #VALUE! | 0 | 129 | 57.89737475 | #VALUE! | #VALUE! | 0 | 0 | MAR | 3/1/2020 | 0 | #VALUE! | ||||||||||||||||||||
| 20200302 | 6 | 0 | 3 | 0 | #DIV/0! | #VALUE! | #VALUE! | 24 | 0 | 0 | #VALUE! | #VALUE! | 0 | 206 | 77.19649967 | #VALUE! | #VALUE! | 0 | 0 | MAR | 3/2/2020 | 0 | #VALUE! | ||||||||||||||||||||
| 20200303 | 6 | 0 | 4 | 0 | 0.0% | #VALUE! | #VALUE! | 30 | 0 | 0 | #VALUE! | #VALUE! | 0 | 302 | 96.49562459 | #VALUE! | #VALUE! | 0 | 0 | MAR | 3/3/2020 | 0 | #VALUE! | ||||||||||||||||||||
| 20200304 | 7 | 0 | 5 | 0 | 0.0% | #VALUE! | #VALUE! | 37 | 0 | 0 | #VALUE! | #VALUE! | 0 | 418 | 115.7947495 | #VALUE! | #VALUE! | 0 | 0 | MAR | 3/4/2020 | 0 | #VALUE! | ||||||||||||||||||||
| 20200305 | 20 | 0 | 8 | 0 | 0.0% | #VALUE! | #VALUE! | 57 | 0 | 0 | #VALUE! | #VALUE! | 0 | 598 | 180.1251659 | #VALUE! | #VALUE! | 0 | 0 | MAR | 3/5/2020 | 0 | #VALUE! | ||||||||||||||||||||
| 20200306 | 30 | 1 | 11 | 0 | 4.5% | #VALUE! | #VALUE! | 87 | 0 | 0 | #VALUE! | #VALUE! | 0 | 852 | 254.1051447 | #VALUE! | #VALUE! | 0 | 0 | MAR | 3/6/2020 | 0 | #VALUE! | ||||||||||||||||||||
| 20200307 | 122 | 0 | 28 | 0 | 5.0% | #VALUE! | #VALUE! | 209 | 0 | 0 | #VALUE! | #VALUE! | 0 | 1486 | 633.6546015 | #VALUE! | #VALUE! | 0 | 0 | MAR | 3/7/2020 | 0 | #VALUE! | ||||||||||||||||||||
| 20200308 | 55 | 0 | 35 | 0 | 4.7% | #VALUE! | #VALUE! | 264 | 0 | 0 | #VALUE! | #VALUE! | 0 | 2277 | 791.2641216 | #VALUE! | #VALUE! | 0 | 0 | MAR | 3/8/2020 | 0 | #VALUE! | ||||||||||||||||||||
| 20200309 | 68 | 1 | 44 | 0 | 5.3% | #VALUE! | #VALUE! | 332 | 0 | 0 | #VALUE! | #VALUE! | 0 | 3268 | 990.6884124 | #VALUE! | #VALUE! | 0 | 0 | MAR | 3/9/2020 | 0 | #VALUE! | ||||||||||||||||||||
| 20200310 | 42 | 0 | 49 | 0 | 5.4% | #VALUE! | #VALUE! | 374 | 0 | 0 | #VALUE! | #VALUE! | 0 | 4374 | 1106.483162 | #VALUE! | #VALUE! | 0 | 0 | MAR | 3/10/2020 | 0 | #VALUE! | ||||||||||||||||||||
| 20200311 | 116 | 1 | 65 | 0 | 5.4% | #VALUE! | #VALUE! | 490 | 0 | 0 | #VALUE! | #VALUE! | 0 | 5832 | 1457.083931 | #VALUE! | #VALUE! | 0 | 0 | MAR | 3/11/2020 | 0 | #VALUE! | ||||||||||||||||||||
| 20200312 | 152 | 1 | 84 | 1 | 5.3% | #VALUE! | #VALUE! | 642 | 0 | 0 | #VALUE! | #VALUE! | 0 | 7713 | 1881.664679 | #VALUE! | #VALUE! | 0 | 0 | MAR | 3/12/2020 | 8443 | #VALUE! | ||||||||||||||||||||
| 20200313 | 212 | 0 | 110 | 0 | 3.7% | #VALUE! | #VALUE! | 854 | 0 | 0 | #VALUE! | #VALUE! | 0 | 10180 | 2467.071469 | #VALUE! | #VALUE! | 0 | 0 | MAR | 3/13/2020 | 18868 | #VALUE! | ||||||||||||||||||||
| 20200314 | 267 | 3 | 130 | 1 | 3.2% | #VALUE! | #VALUE! | 1121 | 0 | 0 | #VALUE! | #VALUE! | 0 | 13114 | 2933.466987 | #VALUE! | #VALUE! | 0 | 0 | MAR | 3/14/2020 | 29068 | #VALUE! | ||||||||||||||||||||
| 20200315 | 238 | 4 | 156 | 1 | 3.2% | #VALUE! | #VALUE! | 1359 | 0 | 0 | #VALUE! | #VALUE! | 0 | 16636 | 3522.090297 | #VALUE! | #VALUE! | 0 | 0 | MAR | 3/15/2020 | 40922 | #VALUE! | ||||||||||||||||||||
| 20200316 | 841 | 2 | 267 | 2 | 3.2% | #VALUE! | #VALUE! | 2200 | 0 | 0 | #VALUE! | #VALUE! | 0 | 22644 | 6008.460891 | #VALUE! | #VALUE! | 0 | 0 | MAR | 3/16/2020 | 52816 | #VALUE! | ||||||||||||||||||||
| 20200317 | 0 | 1 | 261 | 2.4 | 2 | 3.1% | #VALUE! | #VALUE! | 2200 | 0 | 0 | #VALUE! | #VALUE! | 0 | 28518 | 5873.367017 | #VALUE! | #VALUE! | 0 | 0 | MAR | 3/17/2020 | 65133 | #VALUE! | |||||||||||||||||||
| 20200318 | 450 | 5 | 309 | 2.4 | 2 | 3.0% | #VALUE! | #VALUE! | 2650 | 0 | 0 | #VALUE! | #VALUE! | 0 | 35465 | 6947.68497 | #VALUE! | #VALUE! | 0 | 0 | MAR | 3/18/2020 | 77070 | #VALUE! | |||||||||||||||||||
| 20200319 | 353 | 6 | 337 | 2.2 | 3 | 2.9% | #VALUE! | #VALUE! | 3003 | 0 | 0 | #VALUE! | #VALUE! | 0 | 43060 | 7594.205655 | #VALUE! | #VALUE! | 0 | 0 | MAR | 3/19/2020 | 89578 | #VALUE! | |||||||||||||||||||
| 20200320 | 860 | 8 | 430 | 1.6 | 4 | 3.0% | #VALUE! | #VALUE! | #VALUE! | 3863 | 0 | 0 | #VALUE! | #VALUE! | 0 | 52738 | 9678.511146 | #VALUE! | #VALUE! | 0 | 0 | MAR | 3/20/2020 | 101655 | #VALUE! | ||||||||||||||||||
| 20200321 | 943 | 10 | 526 | 2.0 | 4.8 | 5 | 3.1% | 4.0% | 0.8 | 1589 | 4221 | #VALUE! | 4806 | 1589 | 4221 | #VALUE! | #VALUE! | 0 | 64591 | 11852.87922 | 3177 | 8443 | 3177 | 8443 | MAR | 3/21/2020 | 114086 | 138% | |||||||||||||||
| 20200322 | 1271 | 13 | 674 | 2.2 | 5.2 | 6 | 2.9% | 3.8% | 0.8 | 1962 | 5213 | 4146 | #VALUE! | 6077 | 3550 | 9434 | 8292 | #VALUE! | 8292 | 79766 | 15175.54523 | 3923 | 10425 | 7100 | 18868 | MAR | 3/22/2020 | 118227 | 137% | ||||||||||||||
| 20200323 | 894 | 4 | 682 | 2.0 | 4.4 | 7 | 2.8% | 3.7% | 0.8 | 1919 | 5100 | 3566 | #VALUE! | 6971 | 5469 | 14534 | 7131 | #VALUE! | 15423 | 95113 | 15346.02083 | 3838 | 10200 | 10939 | 29068 | MAR | 3/23/2020 | 120330 | 116% | ||||||||||||||
| 20200324 | 1044 | 6 | 831 | 1.9 | 3.1 | 7 | 2.7% | 3.5% | 0.8 | 2230 | 5927 | 4412 | #VALUE! | 8015 | 7700 | 20461 | 8823 | #VALUE! | 24246 | 113817 | 18704.06857 | 4461 | 11854 | 15400 | 40922 | MAR | 3/24/2020 | 122847 | 61% | ||||||||||||||
| 20200325 | 774 | 20 | 877 | 1.7 | 3.4 | 10 | 2.8% | 3.4% | 0.8 | 2238 | 5947 | 2882 | #VALUE! | 8789 | 9938 | 26408 | 5764 | #VALUE! | 30010 | 133563 | 19746.22131 | 4476 | 11894 | 19875 | 52816 | MAR | 3/25/2020 | 124077 | 102% | ||||||||||||||
| 20200326 | 925 | 17 | 959 | 1.4 | 3.1 | 11 | 2.7% | 3.2% | 0.9 | 2318 | 6159 | 3524 | #VALUE! | 9714 | 12255 | 32567 | 7047 | #VALUE! | 37057 | 155149 | 21586.07122 | 4635 | 12318 | 24511 | 65133 | MAR | 3/26/2020 | 124792 | 118% | ||||||||||||||
| 20200327 | 1000 | 58 | 979 | 1.4 | 2.9 | 18 | 2.9% | 3.0% | 0.9 | 2246 | 5968 | 3104 | #VALUE! | 10714 | 14501 | 38535 | 6208 | #VALUE! | 43266 | 177185 | 22036.38413 | 4492 | 11937 | 29003 | 77070 | MAR | 3/27/2020 | 125098 | 102% | ||||||||||||||
| 20200328 | 1390 | 36 | 1043 | 1.3 | 2.4 | 22 | 2.9% | 3.0% | 1.0 | 2353 | 6254 | 3223 | #VALUE! | 12104 | 16855 | 44789 | 6445 | #VALUE! | 49711 | 200659 | 23474.16894 | 4707 | 12508 | 33710 | 89578 | MAR | 3/28/2020 | 125441 | 93% | ||||||||||||||
| 20200329 | 1048 | 38 | 1011 | 1.2 | 1.9 | 26 | 3.1% | 3.0% | 1.0 | 2272 | 6038 | 2376 | #VALUE! | 13152 | 19127 | 50827 | 4753 | #VALUE! | 54464 | 223416 | 22756.8848 | 4545 | 12077 | 38254 | 101655 | MAR | 3/29/2020 | 124347 | 67% | ||||||||||||||
| 20200330 | 1122 | 22 | 1043 | 1.1 | 1.5 | 28 | 3.1% | 2.9% | 1.1 | 2339 | 6215 | 2068 | #VALUE! | 14274 | 21466 | 57043 | 4135 | #VALUE! | 58599 | 246907 | 23490.25155 | 4678 | 12431 | 42932 | 114086 | MAR | 3/30/2020 | 123702 | 42% | ||||||||||||||
| 20200331 | 1138 | 38 | 1057 | 1.1 | 1.6 | 33 | 3.2% | 2.9% | 1.1 | 2368 | 6292 | 1657 | -75% | 15412 | 23834 | 63335 | 3313 | #VALUE! | 61913 | 270699 | 23792.6045 | 4736 | 12585 | 47668 | 126670 | MAR | 3/31/2020 | 122125 | 44% | ||||||||||||||
| 20200401 | 696 | 78 | 1046 | 1.0 | 1.3 | 41 | 3.4% | 3.0% | 1.1 | 2357 | 6264 | 1604 | -71% | 16108 | 26191 | 69599 | 3208 | #VALUE! | 65121 | 294241 | 23541.71588 | 4715 | 12528 | 52383 | 139198 | APR | 4/1/2020 | 119953 | 26% | ||||||||||||||
| 20200402 | 962 | 5 | 1051 | 1.0 | 1.2 | 39 | 3.4% | 3.0% | 1.1 | 2393 | 6358 | 1329 | -76% | 17070 | 28584 | 75957 | 2659 | #VALUE! | 67779 | 317902 | 23660.72715 | 4785 | 12716 | 57168 | 151915 | APR | 4/2/2020 | 117431 | 15% | ||||||||||||||
| 20200403 | 1124 | 54 | 1069 | 1.0 | 1.1 | 39 | 3.5% | 3.0% | 1.1 | 2462 | 6542 | 1302 | -63% | 18194 | 31046 | 82500 | 2604 | #VALUE! | 70383 | 341961 | 24059.57573 | 4924 | 13085 | 62092 | 164999 | APR | 4/3/2020 | 114115 | 9% | ||||||||||||||
| 20200404 | 1033 | 52 | 1018 | 1.0 | 1.0 | 41 | 3.5% | 3.1% | 1.2 | 2372 | 6304 | 1080 | -71% | 19227 | 33418 | 88804 | 2160 | #VALUE! | 72543 | 364872 | 22911.2778 | 4745 | 12608 | 66837 | 177607 | APR | 4/4/2020 | 109706 | 8% | ||||||||||||||
| 20200405 | 974 | 56 | 1007 | 1.0 | 1.0 | 44 | 3.6% | 3.1% | 1.2 | 2375 | 6312 | 1036 | -68% | 20201 | 35794 | 95115 | 2072 | #VALUE! | 74616 | 387546 | 22673.25526 | 4750 | 12624 | 71587 | 190231 | APR | 4/5/2020 | 105328 | 0% | ||||||||||||||
| 20200406 | 821 | 19 | 964 | 0.9 | 1.0 | 43 | 3.6% | 3.2% | 1.2 | 2311 | 6140 | 891 | -70% | 21022 | 38104 | 101256 | 1783 | #VALUE! | 76398 | 409251 | 21705.08249 | 4621 | 12280 | 76208 | 202511 | APR | 4/6/2020 | 100330 | 4% | ||||||||||||||
| 20200407 | 552 | 25 | 880 | 0.8 | 0.8 | 41 | 3.7% | 3.2% | 1.1 | 2148 | 5707 | 767 | -63% | 21574 | 40252 | 106962 | 1533 | #VALUE! | 77932 | 429071 | 19820.20129 | 4295 | 11414 | 80504 | 213925 | APR | 4/7/2020 | 95840 | 2% | ||||||||||||||
| 20200408 | 590 | 57 | 865 | 0.9 | 0.8 | 38 | 3.7% | 3.3% | 1.1 | 2151 | 5716 | 717 | -58% | 22164 | 42403 | 112678 | 1435 | #VALUE! | 79367 | 448550 | 19479.25008 | 4302 | 11432 | 84806 | 225356 | APR | 4/8/2020 | 91277 | -4% | ||||||||||||||
| 20200409 | 546 | 64 | 806 | 0.8 | 0.8 | 47 | 3.7% | 3.3% | 1.1 | 2042 | 5427 | 614 | -51% | 22710 | 44445 | 118105 | 1229 | #VALUE! | 80595 | 466691 | 18141.17742 | 4084 | 10854 | 88890 | 236210 | APR | 4/9/2020 | 85918 | -4% | ||||||||||||||
| 20200410 | 785 | 51 | 757 | 0.8 | 0.7 | 46 | 3.8% | 3.4% | 1.1 | 1959 | 5206 | 548 | -53% | 23495 | 46404 | 123312 | 1097 | #VALUE! | 81692 | 483742 | 17050.77686 | 3919 | 10413 | 92809 | 246623 | APR | 4/10/2020 | 80608 | -8% | ||||||||||||||
| 20200411 | 733 | 49 | 714 | 0.8 | 0.7 | 46 | 3.8% | 3.5% | 1.1 | 1883 | 5003 | 486 | -46% | 24228 | 48287 | 128315 | 971 | #VALUE! | 82664 | 499828 | 16085.82062 | 3765 | 10006 | 96574 | 256629 | APR | 4/11/2020 | 75653 | -18% | ||||||||||||||
| 20200412 | 592 | 26 | 660 | 0.8 | 0.6 | 42 | 3.8% | 3.5% | 1.1 | 1769 | 4700 | 407 | -49% | 24820 | 50056 | 133015 | 815 | #VALUE! | 83479 | 514685 | 14857.10967 | 3538 | 9401 | 100112 | 266030 | APR | 4/12/2020 | 70914 | -15% | ||||||||||||||
| 20200413 | 400 | 27 | 600 | 0.7 | 0.6 | 43 | 3.9% | 3.6% | 1.1 | 1632 | 4338 | 353 | -44% | 25220 | 51688 | 137353 | 707 | #VALUE! | 84185 | 528188 | 13502.9544 | 3265 | 8675 | 103376 | 274705 | APR | 4/13/2020 | 66614 | -20% | ||||||||||||||
| 20200414 | 279 | 0 | 561 | 0.7 | 0.6 | 39 | 3.9% | 3.6% | 1.1 | 1549 | 4115 | 312 | -46% | 25499 | 53237 | 141468 | 624 | #VALUE! | 84810 | 540813 | 12624.84422 | 3097 | 8230 | 106474 | 282935 | APR | 4/14/2020 | 62227 | -21% | ||||||||||||||
| 20200415 | 254 | 42 | 513 | 0.7 | 0.6 | 37 | 3.9% | 3.7% | 1.1 | 1435 | 3813 | 273 | -42% | 25753 | 54672 | 145280 | 545 | #VALUE! | 85355 | 552357 | 11544.09322 | 2870 | 7626 | 109343 | 290561 | APR | 4/15/2020 | 58135 | -19% | ||||||||||||||
| 20200416 | 583 | 73 | 518 | 0.8 | 0.6 | 38 | 4.0% | 3.7% | 1.1 | 1466 | 3895 | 305 | -32% | 26336 | 56137 | 149176 | 610 | #VALUE! | 85965 | 564020 | 11663.10449 | 2932 | 7790 | 112275 | 298351 | APR | 4/16/2020 | 54309 | -24% | ||||||||||||||
| 20200417 | 315 | 43 | 451 | 0.8 | 0.6 | 37 | 4.0% | 3.8% | 1.1 | 1289 | 3425 | 235 | -37% | 26651 | 57426 | 152601 | 470 | #VALUE! | 86435 | 574171 | 10151.33971 | 2578 | 6850 | 114853 | 305202 | APR | 4/17/2020 | 50105 | -26% | ||||||||||||||
| 20200418 | 346 | 42 | 396 | 0.7 | 0.5 | 36 | 4.1% | 3.8% | 1.1 | 1143 | 3036 | 194 | -36% | 26997 | 58569 | 155637 | 388 | #VALUE! | 86823 | 583078 | 8906.546149 | 2285 | 6073 | 117138 | 311274 | APR | 4/18/2020 | 46476 | -26% | ||||||||||||||
| 20200419 | 325 | 52 | 357 | 0.7 | 0.5 | 40 | 4.1% | 3.8% | 1.1 | 1043 | 2772 | 169 | -35% | 27322 | 59612 | 158409 | 337 | #VALUE! | 87161 | 591126 | 8047.735091 | 2086 | 5544 | 119224 | 316818 | APR | 4/19/2020 | 43506 | -28% | ||||||||||||||
| 20200420 | 336 | 24 | 348 | 0.7 | 0.5 | 39 | 4.2% | 3.9% | 1.1 | 1027 | 2729 | 170 | -28% | 27658 | 60639 | 161138 | 340 | #VALUE! | 87500 | 598968 | 7841.877758 | 2054 | 5458 | 121278 | 322276 | APR | 4/20/2020 | 40968 | -21% | ||||||||||||||
| 20200421 | 168 | 7 | 332 | 0.7 | 0.6 | 40 | 4.3% | 3.9% | 1.1 | 991 | 2633 | 167 | -18% | 27826 | 61630 | 163771 | 335 | #VALUE! | 87835 | 606452 | 7484.843947 | 1982 | 5266 | 123260 | 327543 | APR | 4/21/2020 | 38399 | -25% | ||||||||||||||
| 20200422 | 155 | 45 | 318 | 0.8 | 0.6 | 41 | 4.3% | 4.0% | 1.1 | 960 | 2550 | 169 | -10% | 27981 | 62590 | 166322 | 338 | #VALUE! | 88173 | 613619 | 7166.408386 | 1920 | 5101 | 125180 | 332644 | APR | 4/22/2020 | 35935 | -29% | ||||||||||||||
| 20200423 | 205 | 30 | 264 | 0.7 | 0.5 | 35 | 4.4% | 4.0% | 1.1 | 807 | 2144 | 125 | -15% | 28186 | 63397 | 168466 | 249 | #VALUE! | 88422 | 619569 | 5950.563516 | 1614 | 4288 | 126794 | 336932 | APR | 4/23/2020 | 33511 | -30% | ||||||||||||||
| 20200424 | 228 | 51 | 252 | 0.7 | 0.5 | 36 | 4.5% | 4.1% | 1.1 | 779 | 2069 | 124 | -8% | 28414 | 64175 | 170535 | 247 | #VALUE! | 88670 | 625240 | 5670.726205 | 1557 | 4139 | 128351 | 341071 | APR | 4/24/2020 | 31660 | -33% | ||||||||||||||
| 20200425 | 181 | 41 | 228 | 0.7 | 0.5 | 36 | 4.6% | 4.1% | 1.1 | 715 | 1900 | 101 | -25% | 28595 | 64890 | 172435 | 201 | #VALUE! | 88871 | 630380 | 5140.00027 | 1430 | 3800 | 129781 | 344870 | APR | 4/25/2020 | 29777 | -26% | ||||||||||||||
| 20200426 | 216 | 20 | 213 | 0.7 | 0.5 | 31 | 4.6% | 4.2% | 1.1 | 675 | 1793 | 100 | -9% | 28811 | 65565 | 174228 | 201 | #VALUE! | 89072 | 635170 | 4789.3995 | 1350 | 3586 | 131130 | 348456 | APR | 4/26/2020 | 28186 | -20% | ||||||||||||||
| 20200427 | 167 | 8 | 189 | 0.7 | 0.5 | 29 | 4.7% | 4.2% | 1.1 | 606 | 1610 | 90 | -3% | 28978 | 66171 | 175839 | 180 | #VALUE! | 89251 | 639415 | 4245.807482 | 1212 | 3221 | 132342 | 351677 | APR | 4/27/2020 | 26636 | -26% | ||||||||||||||
| 20200428 | 103 | 16 | 179 | 0.7 | 0.5 | 30 | 4.7% | 4.3% | 1.1 | 584 | 1551 | 90 | 6% | 29081 | 66755 | 177390 | 180 | #VALUE! | 89431 | 643452 | 4036.733629 | 1167 | 3102 | 133510 | 354780 | APR | 4/28/2020 | 25217 | -28% | ||||||||||||||
| 20200429 | 100 | 27 | 171 | 0.8 | 0.5 | 28 | 4.8% | 4.3% | 1.1 | 566 | 1503 | 84 | 1% | 29181 | 67321 | 178893 | 169 | #VALUE! | 89600 | 647312 | 3859.824983 | 1131 | 3006 | 134641 | 357786 | APR | 4/29/2020 | 23618 | -31% | ||||||||||||||
| 20200430 | 143 | 28 | 163 | 0.8 | 0.5 | 27 | 4.8% | 4.4% | 1.1 | 544 | 1445 | 80 | -3% | 29324 | 67864 | 180338 | 159 | #VALUE! | 89759 | 650972 | 3660.400693 | 1087 | 2890 | 135728 | 360675 | APR | 4/30/2020 | 22022 | -33% | ||||||||||||||
| 20200501 | 179 | 15 | 156 | 0.8 | 0.6 | 22 | 4.9% | 4.5% | 1.1 | 527 | 1401 | 76 | -8% | 29503 | 68392 | 181739 | 152 | #VALUE! | 89911 | 654475 | 3502.791173 | 1055 | 2802 | 136783 | 363478 | MAY | 5/1/2020 | 20360 | -29% | ||||||||||||||
| 20200502 | 119 | 12 | 147 | 0.8 | 0.6 | 18 | 4.9% | 4.5% | 1.1 | 504 | 1339 | 81 | 18% | 29622 | 68895 | 183077 | 163 | #VALUE! | 90074 | 657779 | 3303.366882 | 1008 | 2677 | 137791 | 366155 | MAY | 5/2/2020 | 18697 | -29% | ||||||||||||||
| 20200503 | 112 | 32 | 132 | 0.8 | 0.6 | 20 | 4.9% | 4.6% | 1.1 | 459 | 1219 | 69 | 7% | 29734 | 69354 | 184296 | 138 | #VALUE! | 90212 | 660747 | 2968.848716 | 917 | 2437 | 138708 | 368592 | MAY | 5/3/2020 | 17060 | -25% | ||||||||||||||
| 20200504 | 88 | 6 | 121 | 0.7 | 0.6 | 19 | 5.0% | 4.6% | 1.1 | 424 | 1128 | 64 | 20% | 29822 | 69778 | 185424 | 127 | #VALUE! | 90339 | 663462 | 2714.743572 | 849 | 2256 | 139557 | 370848 | MAY | 5/4/2020 | 15692 | -24% | ||||||||||||||
| 20200505 | 76 | 4 | 117 | 0.8 | 0.6 | 18 | 5.0% | 4.7% | 1.1 | 416 | 1104 | 64 | 16% | 29898 | 70194 | 186528 | 128 | #VALUE! | 90467 | 666090 | 2627.89751 | 831 | 2209 | 140388 | 373057 | MAY | 5/5/2020 | 14459 | -18% | ||||||||||||||
| 20200506 | 28 | 6 | 106 | 0.7 | 0.6 | 15 | 5.0% | 4.7% | 1.1 | 383 | 1018 | 60 | 18% | 29926 | 70577 | 187546 | 120 | #VALUE! | 90588 | 668486 | 2396.308011 | 766 | 2036 | 141154 | 375092 | MAY | 5/6/2020 | 13231 | -18% | ||||||||||||||
| 20200507 | 51 | 22 | 93 | 0.7 | 0.5 | 14 | 5.0% | 4.8% | 1.1 | 339 | 901 | 49 | 4% | 29977 | 70916 | 188447 | 97 | #VALUE! | 90685 | 670587 | 2100.388095 | 678 | 1802 | 141832 | 376894 | MAY | 5/7/2020 | 12093 | -23% | ||||||||||||||
| 20200508 | 66 | 13 | 77 | 0.6 | 0.5 | 14 | 5.1% | 4.8% | 1.0 | 283 | 752 | 35 | -9% | 30043 | 71199 | 189199 | 69 | #VALUE! | 90754 | 672324 | 1736.921243 | 566 | 1504 | 142398 | 378398 | MAY | 5/8/2020 | 11234 | -26% | ||||||||||||||
| 20200509 | 81 | 8 | 72 | 0.6 | 0.5 | 13 | 5.1% | 4.9% | 1.0 | 265 | 705 | 32 | -10% | 30124 | 71464 | 189904 | 63 | #VALUE! | 90817 | 673938 | 1614.693451 | 530 | 1410 | 142928 | 379807 | MAY | 5/9/2020 | 10561 | -25% | ||||||||||||||
| 20200510 | 44 | 6 | 62 | 0.6 | 0.4 | 9 | 5.1% | 4.9% | 1.0 | 231 | 614 | 25 | -18% | 30168 | 71695 | 190518 | 49 | #VALUE! | 90867 | 675334 | 1395.970036 | 462 | 1228 | 143390 | 381035 | MAY | 5/10/2020 | 9901 | -27% | ||||||||||||||
| 20200511 | 54 | 6 | 57 | 0.4 | 9 | 5.1% | 4.9% | 1.0 | 214 | 570 | 22 | -30% | 30222 | 71910 | 191087 | 45 | #VALUE! | 90911 | 676621 | 1286.608328 | 429 | 1139 | 143819 | 382175 | MAY | 5/11/2020 | 9380 | #VALUE! | |||||||||||||||
| 20200512 | 39 | 5 | 52 | 0.4 | 9 | 5.1% | 5.0% | 1.0 | 196 | 520 | 20 | -25% | 30261 | 72105 | 191607 | 41 | #VALUE! | 90952 | 677788 | 1167.597058 | 391 | 1040 | 144210 | 383215 | MAY | 5/12/2020 | 8971 | #VALUE! | |||||||||||||||
| 20200513 | 36 | 18 | 53 | 0.5 | 11 | 5.1% | 5.0% | 1.0 | 201 | 535 | 23 | -17% | 30297 | 72306 | 192142 | 47 | #VALUE! | 90999 | 678982 | 1193.329224 | 402 | 1069 | 144613 | 384284 | MAY | 5/13/2020 | 8622 | #VALUE! | |||||||||||||||
| 20200514 | 33 | 3 | 50 | 0.5 | 8 | 5.2% | 5.0% | 1.0 | 192 | 511 | 22 | -21% | 30330 | 72499 | 192653 | 44 | #VALUE! | 91042 | 680117 | 1135.431849 | 385 | 1023 | 144998 | 385307 | MAY | 5/14/2020 | 8132 | #VALUE! | |||||||||||||||
| 20200515 | 50 | 25 | 48 | 10 | 5.2% | 5.0% | 1.0 | 185 | 490 | 22 | -20% | 30380 | 72683 | 193144 | 44 | #VALUE! | 91086 | 681201 | 1083.967516 | 369 | 981 | 145367 | 386288 | MAY | 5/15/2020 | 7571 | #VALUE! | ||||||||||||||||
| 20200516 | 51 | 6 | 44 | 10 | 5.2% | 5.1% | 1.0 | 169 | 449 | -10% | 30431 | 72852 | 193593 | #VALUE! | #VALUE! | 91086 | 682189 | 987.4718916 | 338 | 898 | 145705 | 387185 | MAY | 5/16/2020 | 7040 | #VALUE! | |||||||||||||||||
| 20200517 | 58 | 7 | 46 | 10 | 5.2% | 5.1% | 1.0 | 177 | 471 | 32% | 30489 | 73030 | 194064 | #VALUE! | #VALUE! | 91086 | 683221 | 1032.503183 | 355 | 943 | 146059 | 388128 | MAY | 5/17/2020 | 6594 | #VALUE! | |||||||||||||||||
| 20200518 | 15 | 1 | 40 | 9 | 5.2% | 5.1% | 1.0 | 156 | 416 | 27% | 30504 | 73186 | 194480 | #VALUE! | #VALUE! | 91086 | 684128 | 907.0588711 | 313 | 831 | 146372 | 388959 | MAY | 5/18/2020 | 5652 | #VALUE! | |||||||||||||||||
| 20200519 | 10 | 0 | 36 | 9 | 5.3% | 5.1% | 1.0 | 141 | 374 | 46% | 30514 | 73327 | 194854 | #VALUE! | #VALUE! | 91086 | 684942 | 813.7797673 | 282 | 749 | 146654 | 389708 | MAY | 5/19/2020 | 4820 | #VALUE! | |||||||||||||||||
| 20200520 | 21 | 11 | 34 | 8 | 5.3% | 5.1% | 1.0 | 133 | 354 | 53% | 30535 | 73460 | 195208 | #VALUE! | #VALUE! | 91086 | 685708 | 765.5319551 | 266 | 707 | 146920 | 390415 | MAY | 5/20/2020 | 4071 | #VALUE! | |||||||||||||||||
| 20200521 | 40 | 16 | 35 | 9 | 5.3% | 5.2% | 1.0 | 137 | 365 | 72% | 30575 | 73598 | 195573 | #VALUE! | #VALUE! | 91086 | 686496 | 788.0476008 | 275 | 731 | 147195 | 391146 | MAY | 5/21/2020 | 3364 | #VALUE! | |||||||||||||||||
| 20200522 | 36 | 8 | 33 | 7 | 5.3% | 5.2% | 1.0 | 130 | 346 | 42% | 30611 | 73728 | 195918 | #VALUE! | #VALUE! | 91086 | 687239 | 743.0163093 | 260 | 691 | 147455 | 391837 | MAY | 5/22/2020 | 2634 | #VALUE! | |||||||||||||||||
| 20200523 | 13 | 0 | 28 | 6 | 5.3% | 5.2% | 1.0 | 109 | 290 | 27% | 30624 | 73837 | 196208 | #VALUE! | #VALUE! | 91086 | 687859 | 620.7885182 | 218 | 580 | 147673 | 392416 | MAY | 5/23/2020 | 1943 | #VALUE! | |||||||||||||||||
| 20200524 | 18 | 4 | 22 | 6 | 5.3% | 5.2% | 1.0 | 87 | 230 | 0% | 30642 | 73923 | 196439 | #VALUE! | #VALUE! | 91086 | 688352 | 492.1276854 | 173 | 461 | 147847 | 392877 | MAY | 5/24/2020 | 1363 | #VALUE! | |||||||||||||||||
| 20200525 | 11 | 0 | 21 | 6 | 5.4% | 5.2% | 1.0 | 85 | 225 | #VALUE! | 30653 | 74008 | 196664 | #VALUE! | #VALUE! | 91086 | 688831 | 479.2616021 | 169 | 450 | 148016 | 393328 | MAY | 5/25/2020 | 902 | #VALUE! | |||||||||||||||||
| 20200526 | 10 | 0 | 21 | 6 | 5.4% | 5.3% | 1.0 | 85 | 226 | #VALUE! | 30663 | 74093 | 196890 | #VALUE! | #VALUE! | 91086 | 689310 | 479.2616021 | 170 | 452 | 148186 | 393780 | MAY | 5/26/2020 | 452 | #VALUE! | |||||||||||||||||
| 20200527 | 15 | 6 | 20 | 5 | 5.4% | #VALUE! | #VALUE! | #VALUE! | 30678 | 74093 | 196890 | #VALUE! | #VALUE! | 91086 | 689770 | 459.9624772 | #VALUE! | #VALUE! | 148186 | 393780 | MAY | 5/27/2020 | 0 | #VALUE! | |||||||||||||||||||
| 20200528 | 0 | 0 | 15 | 3 | 5.4% | #VALUE! | #VALUE! | #VALUE! | 30678 | 74093 | 196890 | #VALUE! | #VALUE! | 91086 | 690101 | 331.3016444 | #VALUE! | #VALUE! | 148186 | 393780 | MAY | 5/28/2020 | 0 | #VALUE! | |||||||||||||||||||
| 20200529 | 35 | 7 | 15 | 2 | 5.4% | #VALUE! | #VALUE! | #VALUE! | 30713 | 74093 | 196890 | #VALUE! | #VALUE! | 91086 | 690429 | 328.0851236 | #VALUE! | #VALUE! | 148186 | 393780 | MAY | 5/29/2020 | 0 | #VALUE! | |||||||||||||||||||
| 20200530 | 32 | 2 | 17 | 3 | 5.4% | #VALUE! | #VALUE! | #VALUE! | 30745 | 74093 | 196890 | #VALUE! | #VALUE! | 91086 | 690819 | 389.1990192 | #VALUE! | #VALUE! | 148186 | 393780 | MAY | 5/30/2020 | 0 | #VALUE! | |||||||||||||||||||
| 20200531 | 17 | 0 | 17 | 2 | 5.4% | #VALUE! | #VALUE! | #VALUE! | 30762 | 74093 | 196890 | #VALUE! | #VALUE! | 91086 | 691205 | 385.9824983 | #VALUE! | #VALUE! | 148186 | 393780 | MAY | 5/31/2020 | 0 | #VALUE! | |||||||||||||||||||
| 20200601 | 17 | 0 | 18 | 2 | 5.4% | #VALUE! | #VALUE! | #VALUE! | 30779 | 74093 | 196890 | #VALUE! | #VALUE! | 91086 | 691610 | 405.2816233 | #VALUE! | #VALUE! | 148186 | 393780 | JUN | 6/1/2020 | 0 | #VALUE! | |||||||||||||||||||
| 20200602 | 9 | 0 | 18 | 2 | 5.4% | #VALUE! | #VALUE! | #VALUE! | 30788 | 74093 | 196890 | #VALUE! | #VALUE! | 91086 | 692012 | 402.0651024 | #VALUE! | #VALUE! | 148186 | 393780 | JUN | 6/2/2020 | 0 | #VALUE! | |||||||||||||||||||
| 20200603 | 3 | 0 | 16 | 1 | 5.4% | #VALUE! | #VALUE! | #VALUE! | 30791 | 74093 | 196890 | #VALUE! | #VALUE! | 91086 | 692375 | 363.4668526 | #VALUE! | #VALUE! | 148186 | 393780 | JUN | 6/3/2020 | 0 | #VALUE! | |||||||||||||||||||
| 20200604 | 19 | 3 | 19 | 2 | 5.4% | #VALUE! | #VALUE! | #VALUE! | 30810 | 74093 | 196890 | #VALUE! | #VALUE! | 91086 | 692800 | 424.5807482 | #VALUE! | #VALUE! | 148186 | 393780 | JUN | 6/4/2020 | 0 | #VALUE! | |||||||||||||||||||
| 20200605 | 20 | 0 | 17 | 1 | 5.4% | #VALUE! | #VALUE! | #VALUE! | 30830 | 74093 | 196890 | #VALUE! | #VALUE! | 91086 | 693176 | 376.3329359 | #VALUE! | #VALUE! | 148186 | 393780 | JUN | 6/5/2020 | 0 | #VALUE! | |||||||||||||||||||
| 20200606 | 23 | 0 | 15 | 0 | 5.4% | #VALUE! | #VALUE! | #VALUE! | 30853 | 74093 | 196890 | #VALUE! | #VALUE! | 91086 | 693524 | 347.3842485 | #VALUE! | #VALUE! | 148186 | 393780 | JUN | 6/6/2020 | 0 | #VALUE! | |||||||||||||||||||
| 20200607 | 20 | 1 | 16 | 1 | 5.4% | #VALUE! | #VALUE! | #VALUE! | 30873 | 74093 | 196890 | #VALUE! | #VALUE! | 91086 | 693881 | 357.033811 | #VALUE! | #VALUE! | 148186 | 393780 | JUN | 6/7/2020 | 0 | #VALUE! | |||||||||||||||||||
| 20200608 | 9 | 0 | 15 | 1 | 5.4% | #VALUE! | #VALUE! | #VALUE! | 30882 | 74093 | 196890 | #VALUE! | #VALUE! | 91086 | 694212 | 331.3016444 | #VALUE! | #VALUE! | 148186 | 393780 | JUN | 6/8/2020 | 0 | #VALUE! | |||||||||||||||||||
| 20200609 | 7 | 0 | 14 | 1 | 5.4% | #VALUE! | #VALUE! | #VALUE! | 30889 | 74093 | 196890 | #VALUE! | #VALUE! | 91086 | 694537 | 324.8686028 | #VALUE! | #VALUE! | 148186 | 393780 | JUN | 6/9/2020 | 0 | #VALUE! | |||||||||||||||||||
| 20200610 | 16 | 2 | 16 | 1 | 5.4% | #VALUE! | #VALUE! | #VALUE! | 30905 | 74093 | 196890 | #VALUE! | #VALUE! | 91086 | 694904 | 366.6833734 | #VALUE! | #VALUE! | 148186 | 393780 | JUN | 6/10/2020 | 0 | #VALUE! | |||||||||||||||||||
| 20200611 | 23 | 12 | 17 | 2 | 5.4% | #VALUE! | #VALUE! | #VALUE! | 30928 | 74093 | 196890 | #VALUE! | #VALUE! | 91086 | 695283 | 379.5494567 | #VALUE! | #VALUE! | 148186 | 393780 | JUN | 6/11/2020 | 0 | #VALUE! | |||||||||||||||||||
| 20200612 | 33 | 0 | 19 | 2 | 5.4% | #VALUE! | #VALUE! | #VALUE! | 30961 | 74093 | 196890 | #VALUE! | #VALUE! | 91086 | 695705 | 421.3642274 | #VALUE! | #VALUE! | 148186 | 393780 | JUN | 6/12/2020 | 0 | #VALUE! | |||||||||||||||||||
| 20200613 | 19 | 2 | 18 | 2 | 5.4% | #VALUE! | #VALUE! | #VALUE! | 30980 | 74093 | 196890 | #VALUE! | #VALUE! | 91086 | 696113 | 408.4981441 | #VALUE! | #VALUE! | 148186 | 393780 | JUN | 6/13/2020 | 0 | #VALUE! | |||||||||||||||||||
| 20200614 | 31 | 0 | 20 | 2 | 5.4% | #VALUE! | #VALUE! | #VALUE! | 31011 | 74093 | 196890 | #VALUE! | #VALUE! | 91086 | 696557 | 443.8798731 | #VALUE! | #VALUE! | 148186 | 393780 | JUN | 6/14/2020 | 0 | #VALUE! | |||||||||||||||||||
| 20200615 | 23 | 0 | 22 | 2 | 5.4% | #VALUE! | #VALUE! | #VALUE! | 31034 | 74093 | 196890 | #VALUE! | #VALUE! | 91086 | 697046 | 488.9111646 | #VALUE! | #VALUE! | 148186 | 393780 | JUN | 6/15/2020 | 0 | #VALUE! | |||||||||||||||||||
| 20200616 | 14 | 0 | 23 | 2 | 5.4% | #VALUE! | #VALUE! | #VALUE! | 31048 | 74093 | 196890 | #VALUE! | #VALUE! | 91086 | 697557 | 511.4268103 | #VALUE! | #VALUE! | 148186 | 393780 | JUN | 6/16/2020 | 0 | #VALUE! | |||||||||||||||||||
| 20200617 | 15 | 1 | 23 | 2 | 5.4% | #VALUE! | #VALUE! | #VALUE! | 31063 | 74093 | 196890 | #VALUE! | #VALUE! | 91086 | 698065 | 508.2102895 | #VALUE! | #VALUE! | 148186 | 393780 | JUN | 6/17/2020 | 0 | #VALUE! | |||||||||||||||||||
| 20200618 | 37 | 0 | 25 | 0 | 5.4% | #VALUE! | #VALUE! | #VALUE! | 31100 | 74093 | 196890 | #VALUE! | #VALUE! | 91086 | 698619 | 553.241581 | #VALUE! | #VALUE! | 148186 | 393780 | JUN | 6/18/2020 | 0 | #VALUE! | |||||||||||||||||||
| 20200619 | 17 | 0 | 22 | 0 | 5.4% | #VALUE! | #VALUE! | #VALUE! | 31117 | 74093 | 196890 | #VALUE! | #VALUE! | 91086 | 699120 | 501.7772479 | #VALUE! | #VALUE! | 148186 | 393780 | JUN | 6/19/2020 | 0 | #VALUE! | |||||||||||||||||||
| 20200620 | 92 | 0 | 33 | 0 | 5.4% | #VALUE! | #VALUE! | #VALUE! | 31209 | 74093 | 196890 | #VALUE! | #VALUE! | 91086 | 699857 | 736.5832677 | #VALUE! | #VALUE! | 148186 | 393780 | JUN | 6/20/2020 | 0 | #VALUE! | |||||||||||||||||||
| 20200621 | 0 | 0 | 28 | 0 | 5.4% | #VALUE! | #VALUE! | #VALUE! | 31209 | 74093 | 196890 | #VALUE! | #VALUE! | 91086 | 700494 | 636.8711223 | #VALUE! | #VALUE! | 148186 | 393780 | JUN | 6/21/2020 | 0 | #VALUE! | |||||||||||||||||||
| 20200622 | 0 | 2 | 25 | 0 | 5.4% | #VALUE! | #VALUE! | #VALUE! | 31209 | 74093 | 196890 | #VALUE! | #VALUE! | 91086 | 701057 | 562.8911434 | #VALUE! | #VALUE! | 148186 | 393780 | JUN | 6/22/2020 | 0 | #VALUE! | |||||||||||||||||||
| 20200623 | 18 | 0 | 26 | 0 | 5.4% | #VALUE! | #VALUE! | #VALUE! | 31227 | 74093 | 196890 | #VALUE! | #VALUE! | 91086 | 701633 | 575.7572267 | #VALUE! | #VALUE! | 148186 | 393780 | JUN | 6/23/2020 | 0 | #VALUE! | |||||||||||||||||||
| 20200624 | 22 | 0 | 27 | 0 | 5.4% | #VALUE! | #VALUE! | #VALUE! | 31249 | 74093 | 196890 | #VALUE! | #VALUE! | 91086 | 702231 | 598.2728724 | #VALUE! | #VALUE! | 148186 | 393780 | JUN | 6/24/2020 | 0 | #VALUE! | |||||||||||||||||||
| 20200625 | 44 | 2 | 28 | 1 | 5.4% | #VALUE! | #VALUE! | #VALUE! | 31293 | 74093 | 196890 | #VALUE! | #VALUE! | 91086 | 702852 | 620.7885182 | #VALUE! | #VALUE! | 148186 | 393780 | JUN | 6/25/2020 | 0 | #VALUE! | |||||||||||||||||||
| 20200626 | 52 | 0 | 33 | 1 | 5.4% | #VALUE! | #VALUE! | #VALUE! | 31345 | 74093 | 196890 | #VALUE! | #VALUE! | 91086 | 703585 | 733.3667469 | #VALUE! | #VALUE! | 148186 | 393780 | JUN | 6/26/2020 | 0 | #VALUE! | |||||||||||||||||||
| 20200627 | 58 | 0 | 28 | 1 | 5.4% | #VALUE! | #VALUE! | #VALUE! | 31403 | 74093 | 196890 | #VALUE! | #VALUE! | 91086 | 704209 | 624.005039 | #VALUE! | #VALUE! | 148186 | 393780 | JUN | 6/27/2020 | 0 | #VALUE! | |||||||||||||||||||
| 20200628 | 69 | 0 | 38 | 1 | 5.4% | #VALUE! | #VALUE! | #VALUE! | 31472 | 74093 | 196890 | #VALUE! | #VALUE! | 91086 | 705055 | 845.9449755 | #VALUE! | #VALUE! | 148186 | 393780 | JUN | 6/28/2020 | 0 | #VALUE! | |||||||||||||||||||
| 20200629 | 62 | 0 | 46 | 0 | 5.4% | #VALUE! | #VALUE! | #VALUE! | 31534 | 74093 | 196890 | #VALUE! | #VALUE! | 91086 | 706100 | 1045.369266 | #VALUE! | #VALUE! | 148186 | 393780 | JUN | 6/29/2020 | 0 | #VALUE! | |||||||||||||||||||
| 20200630 | 35 | 0 | 49 | 0 | 5.4% | #VALUE! | #VALUE! | #VALUE! | 31569 | 74093 | 196890 | #VALUE! | #VALUE! | 91086 | 707200 | 1100.05012 | #VALUE! | #VALUE! | 148186 | 393780 | JUN | 6/30/2020 | 0 | #VALUE! | |||||||||||||||||||
| 20200701 | 62 | 2 | 55 | 1 | 5.4% | #VALUE! | #VALUE! | #VALUE! | 31631 | 74093 | 196890 | #VALUE! | #VALUE! | 91086 | 708429 | 1228.710953 | #VALUE! | #VALUE! | 148186 | 393780 | JUL | 7/1/2020 | 0 | #VALUE! | |||||||||||||||||||
| 20200702 | 220 | 1 | 80 | 0 | 5.4% | #VALUE! | #VALUE! | #VALUE! | 31851 | 74093 | 196890 | #VALUE! | #VALUE! | 91086 | 710224 | 1794.818617 | #VALUE! | #VALUE! | 148186 | 393780 | JUL | 7/2/2020 | 0 | #VALUE! | |||||||||||||||||||
| 20200703 | 33 | 1 | 77 | 1 | 5.4% | #VALUE! | #VALUE! | #VALUE! | 31884 | 74093 | 196890 | #VALUE! | #VALUE! | 91086 | 711958 | 1733.704722 | #VALUE! | #VALUE! | 148186 | 393780 | JUL | 7/3/2020 | 0 | #VALUE! | |||||||||||||||||||
| 20200704 | 133 | 0 | 88 | 1 | 5.4% | #VALUE! | #VALUE! | #VALUE! | 32017 | 74093 | 196890 | #VALUE! | #VALUE! | 91086 | 713933 | 1974.943783 | #VALUE! | #VALUE! | 148186 | 393780 | JUL | 7/4/2020 | 0 | #VALUE! | |||||||||||||||||||
| 20200705 | 97 | 0 | 92 | 1 | 5.4% | #VALUE! | #VALUE! | #VALUE! | 32114 | 74093 | 196890 | #VALUE! | #VALUE! | 91086 | 715998 | 2065.006366 | #VALUE! | #VALUE! | 148186 | 393780 | JUL | 7/5/2020 | 0 | #VALUE! | |||||||||||||||||||
| 20200706 | 70 | 0 | 93 | 1 | 5.4% | #VALUE! | #VALUE! | #VALUE! | 32184 | 74093 | 196890 | #VALUE! | #VALUE! | 91086 | 718088 | 2090.738533 | #VALUE! | #VALUE! | 148186 | 393780 | JUL | 7/6/2020 | 0 | #VALUE! | |||||||||||||||||||
| 20200707 | 46 | 0 | 94 | 1 | 5.4% | #VALUE! | #VALUE! | #VALUE! | 32230 | 74093 | 196890 | #VALUE! | #VALUE! | 91086 | 720214 | 2126.120262 | #VALUE! | #VALUE! | 148186 | 393780 | JUL | 7/7/2020 | 0 | #VALUE! | |||||||||||||||||||
| 20200708 | 54 | 0 | 93 | 0 | 5.3% | #VALUE! | #VALUE! | #VALUE! | 32284 | 74093 | 196890 | #VALUE! | #VALUE! | 91086 | 722315 | 2100.388095 | #VALUE! | #VALUE! | 148186 | 393780 | JUL | 7/8/2020 | 0 | #VALUE! | |||||||||||||||||||
| 20200709 | 129 | 0 | 80 | 0 | 5.3% | #VALUE! | #VALUE! | #VALUE! | 32413 | 74093 | 196890 | #VALUE! | #VALUE! | 91086 | 724122 | 1807.684701 | #VALUE! | #VALUE! | 148186 | 393780 | JUL | 7/9/2020 | 0 | #VALUE! | |||||||||||||||||||
| 20200710 | 88 | 0 | 88 | 0 | 5.3% | #VALUE! | #VALUE! | #VALUE! | 32501 | 74093 | 196890 | #VALUE! | #VALUE! | 91086 | 726107 | 1984.593346 | #VALUE! | #VALUE! | 148186 | 393780 | JUL | 7/10/2020 | 0 | #VALUE! | |||||||||||||||||||
| 20200711 | 104 | 0 | 84 | 0 | 5.3% | #VALUE! | #VALUE! | #VALUE! | 32605 | 74093 | 196890 | #VALUE! | #VALUE! | 91086 | 727998 | 1891.314242 | #VALUE! | #VALUE! | 148186 | 393780 | JUL | 7/11/2020 | 0 | #VALUE! | |||||||||||||||||||
| 20200712 | 108 | 0 | 86 | 0 | 5.3% | #VALUE! | #VALUE! | #VALUE! | 32713 | 74093 | 196890 | #VALUE! | #VALUE! | 91086 | 729925 | 1926.695971 | #VALUE! | #VALUE! | 148186 | 393780 | JUL | 7/12/2020 | 0 | #VALUE! | |||||||||||||||||||
| 20200713 | 85 | 0 | 88 | 0 | 5.3% | #VALUE! | #VALUE! | #VALUE! | 32798 | 74093 | 196890 | #VALUE! | #VALUE! | 91086 | 731900 | 1974.943783 | #VALUE! | #VALUE! | 148186 | 393780 | JUL | 7/13/2020 | 0 | #VALUE! | |||||||||||||||||||
| 20200714 | 63 | 0 | 90 | 0 | 5.3% | #VALUE! | #VALUE! | #VALUE! | 32861 | 74093 | 196890 | #VALUE! | #VALUE! | 91086 | 733930 | 2029.624637 | #VALUE! | #VALUE! | 148186 | 393780 | JUL | 7/14/2020 | 0 | #VALUE! | |||||||||||||||||||
| 20200715 | 70 | 2 | 92 | 0 | 5.2% | #VALUE! | #VALUE! | #VALUE! | 32931 | 74093 | 196890 | #VALUE! | #VALUE! | 91086 | 736011 | 2081.08897 | #VALUE! | #VALUE! | 148186 | 393780 | JUL | 7/15/2020 | 0 | #VALUE! | |||||||||||||||||||
| 20200716 | 132 | 0 | 93 | 0 | 5.2% | #VALUE! | #VALUE! | #VALUE! | 33063 | 74093 | 196890 | #VALUE! | #VALUE! | 91086 | 738101 | 2090.738533 | #VALUE! | #VALUE! | 148186 | 393780 | JUL | 7/16/2020 | 0 | #VALUE! | |||||||||||||||||||
| 20200717 | 142 | 0 | 101 | 0 | 5.2% | #VALUE! | #VALUE! | #VALUE! | 33205 | 74093 | 196890 | #VALUE! | #VALUE! | 91086 | 740366 | 2264.430657 | #VALUE! | #VALUE! | 148186 | 393780 | JUL | 7/17/2020 | 0 | #VALUE! | |||||||||||||||||||
| 20200718 | 91 | 0 | 99 | 0 | 5.2% | #VALUE! | #VALUE! | #VALUE! | 33296 | 74093 | 196890 | #VALUE! | #VALUE! | 91086 | 742589 | 2222.615886 | #VALUE! | #VALUE! | 148186 | 393780 | JUL | 7/18/2020 | 0 | #VALUE! | |||||||||||||||||||
| 20200719 | 110 | 0 | 99 | 0 | 5.2% | #VALUE! | #VALUE! | #VALUE! | 33406 | 74093 | 196890 | #VALUE! | #VALUE! | 91086 | 744818 | 2229.048928 | #VALUE! | #VALUE! | 148186 | 393780 | JUL | 7/19/2020 | 0 | #VALUE! | |||||||||||||||||||
| 20200720 | 98 | 0 | 101 | 0 | 5.2% | #VALUE! | #VALUE! | #VALUE! | 33504 | 74093 | 196890 | #VALUE! | #VALUE! | 91086 | 747088 | 2270.863699 | #VALUE! | #VALUE! | 148186 | 393780 | JUL | 7/20/2020 | 0 | #VALUE! | |||||||||||||||||||
| 20200721 | 43 | 0 | 98 | 1.0 | 0 | 5.2% | #VALUE! | #VALUE! | #VALUE! | 33547 | 74093 | 196890 | #VALUE! | #VALUE! | 91086 | 749295 | 2206.533282 | #VALUE! | #VALUE! | 148186 | 393780 | JUL | 7/21/2020 | 0 | #VALUE! | ||||||||||||||||||
| 20200722 | 108 | 3 | 103 | 0 | 5.1% | #VALUE! | #VALUE! | #VALUE! | 33655 | 74093 | 196890 | #VALUE! | #VALUE! | 91086 | 751624 | 2328.761073 | #VALUE! | #VALUE! | 148186 | 393780 | JUL | 7/22/2020 | 0 | #VALUE! | |||||||||||||||||||
| 20200723 | 141 | 2 | 105 | 1 | 5.1% | #VALUE! | #VALUE! | #VALUE! | 33796 | 74093 | 196890 | #VALUE! | #VALUE! | 91086 | 753981 | 2357.709761 | #VALUE! | #VALUE! | 148186 | 393780 | JUL | 7/23/2020 | 0 | #VALUE! | |||||||||||||||||||
| 20200724 | 117 | 1 | 101 | 1.0 | 1 | 5.1% | #VALUE! | #VALUE! | #VALUE! | 33913 | 74093 | 196890 | #VALUE! | #VALUE! | 91086 | 756259 | 2277.29674 | #VALUE! | #VALUE! | 148186 | 393780 | JUL | 7/24/2020 | 0 | #VALUE! | ||||||||||||||||||
| 20200725 | 154 | 6 | 110 | 1.1 | 2 | 5.1% | #VALUE! | #VALUE! | #VALUE! | 34067 | 74093 | 196890 | #VALUE! | #VALUE! | 91086 | 758739 | 2479.937552 | #VALUE! | #VALUE! | 148186 | 393780 | JUL | 7/25/2020 | 0 | #VALUE! | ||||||||||||||||||
| 20200726 | 148 | 0 | 116 | 1.1 | 2 | 5.1% | #VALUE! | #VALUE! | 133 | #VALUE! | 34215 | 74093 | 196890 | 266 | #VALUE! | 91351 | 761341 | 2602.165343 | #VALUE! | #VALUE! | 148186 | 393780 | JUL | 7/26/2020 | 0 | #VALUE! | |||||||||||||||||
| 20200727 | 110 | 1 | 117 | 1.1 | 2 | 5.1% | #VALUE! | #VALUE! | #VALUE! | 34325 | 74093 | 196890 | #VALUE! | #VALUE! | 91351 | 763982 | 2640.763593 | #VALUE! | #VALUE! | 148186 | 393780 | JUL | 7/27/2020 | 0 | #VALUE! | ||||||||||||||||||
| 20200728 | 65 | 0 | 120 | 1.2 | 1.2 | 2 | 5.1% | #VALUE! | #VALUE! | #VALUE! | 34390 | 74093 | 196890 | #VALUE! | #VALUE! | 91351 | 766693 | 2711.527051 | #VALUE! | #VALUE! | 148186 | 393780 | JUL | 7/28/2020 | 0 | 0% | |||||||||||||||||
| 20200729 | 132 | 2 | 124 | 1.1 | 2 | 5.1% | #VALUE! | #VALUE! | 152 | #VALUE! | 34522 | 74093 | 196890 | 304 | #VALUE! | 91656 | 769482 | 2788.723551 | #VALUE! | #VALUE! | 148186 | 393780 | JUL | 7/29/2020 | 0 | #VALUE! | |||||||||||||||||
| 20200730 | 192 | 0 | 131 | 1.1 | 1.3 | 1 | 5.1% | #VALUE! | #VALUE! | #VALUE! | 34714 | 74093 | 196890 | #VALUE! | #VALUE! | 91656 | 772435 | 2952.766112 | #VALUE! | #VALUE! | 148186 | 393780 | JUL | 7/30/2020 | 0 | 12% | |||||||||||||||||
| 20200731 | 219 | 1 | 146 | 1.2 | 1.4 | 1 | 5.0% | #VALUE! | #VALUE! | 205 | #VALUE! | 34933 | 74093 | 196890 | 411 | #VALUE! | 92066 | 775715 | 3280.851236 | #VALUE! | #VALUE! | 148186 | 393780 | JUL | 7/31/2020 | 0 | 12% | ||||||||||||||||
| 20200801 | 137 | 0 | 143 | 1.2 | 1.4 | 1 | 5.0% | #VALUE! | #VALUE! | 196 | #VALUE! | 35070 | 74093 | 196890 | 392 | #VALUE! | 92458 | 778942 | 3226.170382 | #VALUE! | #VALUE! | 148186 | 393780 | AUG | 8/1/2020 | 0 | 19% | ||||||||||||||||
| 20200802 | 342 | 2 | 171 | 1.4 | 1.6 | 1 | 5.0% | #VALUE! | #VALUE! | 289 | #VALUE! | 35412 | 74093 | 196890 | 578 | #VALUE! | 93037 | 782792 | 3850.175421 | #VALUE! | #VALUE! | 148186 | 393780 | AUG | 8/2/2020 | 0 | 12% | ||||||||||||||||
| 20200803 | 49 | 0 | 162 | 1.2 | 1.4 | 1 | 5.0% | #VALUE! | #VALUE! | 239 | #VALUE! | 35461 | 74093 | 196890 | 478 | #VALUE! | 93515 | 786446 | 3653.967651 | #VALUE! | #VALUE! | 148186 | 393780 | AUG | 8/3/2020 | 0 | 13% | ||||||||||||||||
| 20200804 | 66 | 0 | 162 | 1.1 | 1.4 | 1 | 5.0% | #VALUE! | #VALUE! | 228 | 22% | 35527 | 74093 | 196890 | 457 | #VALUE! | 93971 | 790103 | 3657.184172 | #VALUE! | #VALUE! | 148186 | 393780 | AUG | 8/4/2020 | 0 | 24% | ||||||||||||||||
| 20200805 | 130 | 0 | 162 | 1.1 | 1.3 | 0 | 5.0% | #VALUE! | #VALUE! | 224 | #VALUE! | 35657 | 74093 | 196890 | 448 | #VALUE! | 94420 | 793754 | 3650.75113 | #VALUE! | #VALUE! | 148186 | 393780 | AUG | 8/5/2020 | 0 | 19% | ||||||||||||||||
| 20200806 | 181 | 0 | 161 | 0.9 | 1.3 | 0 | 4.9% | #VALUE! | #VALUE! | 214 | #VALUE! | 35838 | 74093 | 196890 | 428 | #VALUE! | 94848 | 797369 | 3615.369401 | #VALUE! | #VALUE! | 148186 | 393780 | AUG | 8/6/2020 | 0 | 38% | ||||||||||||||||
| 20200807 | 181 | 3 | 155 | 1.0 | 1.2 | 1 | 4.9% | #VALUE! | #VALUE! | 194 | 2% | 36019 | 74093 | 196890 | 389 | #VALUE! | 95236 | 800862 | 3493.14161 | #VALUE! | #VALUE! | 148186 | 393780 | AUG | 8/7/2020 | 0 | 24% | ||||||||||||||||
| 20200808 | 161 | 3 | 159 | 1.0 | 1.1 | 1 | 4.9% | #VALUE! | #VALUE! | 192 | #VALUE! | 36180 | 74093 | 196890 | 383 | #VALUE! | 95620 | 804433 | 3570.33811 | #VALUE! | #VALUE! | 148186 | 393780 | AUG | 8/8/2020 | 0 | 11% | ||||||||||||||||
| 20200809 | 182 | 0 | 136 | 0.8 | 0.9 | 1 | 4.9% | #VALUE! | #VALUE! | 126 | -34% | 36362 | 74093 | 196890 | 253 | #VALUE! | 95873 | 807488 | 3055.694779 | #VALUE! | #VALUE! | 148186 | 393780 | AUG | 8/9/2020 | 0 | 13% | ||||||||||||||||
| 20200810 | 152 | 0 | 150 | 0.9 | 0.9 | 1 | 4.9% | #VALUE! | #VALUE! | 158 | -23% | 36514 | 74093 | 196890 | 316 | #VALUE! | 96189 | 810875 | 3386.996423 | #VALUE! | #VALUE! | 148186 | 393780 | AUG | 8/10/2020 | 0 | -6% | ||||||||||||||||
| 20200811 | 105 | 0 | 156 | 1.0 | 1.0 | 1 | 4.8% | #VALUE! | #VALUE! | 142 | -46% | 36619 | 74093 | 196890 | 285 | #VALUE! | 96473 | 814388 | 3512.440735 | #VALUE! | #VALUE! | 148186 | 393780 | AUG | 8/11/2020 | 0 | -4% | ||||||||||||||||
| 20200812 | 187 | 1 | 164 | 1.0 | 1.0 | 1 | 4.8% | #VALUE! | #VALUE! | 166 | -31% | 36806 | 74093 | 196890 | 332 | #VALUE! | 96805 | 818083 | 3695.782422 | #VALUE! | #VALUE! | 148186 | 393780 | AUG | 8/12/2020 | 0 | -2% | ||||||||||||||||
| 20200813 | 273 | 1 | 177 | 1.3 | 1.1 | 1 | 4.8% | #VALUE! | #VALUE! | 194 | -22% | 37079 | 74093 | 196890 | 387 | #VALUE! | 97192 | 822075 | 3991.702337 | #VALUE! | #VALUE! | 148186 | 393780 | AUG | 8/13/2020 | 0 | -16% | ||||||||||||||||
| 20200814 | 233 | 1 | 185 | 1.2 | 1.2 | 1 | 4.8% | #VALUE! | #VALUE! | 210 | -18% | 37312 | 74093 | 196890 | 421 | #VALUE! | 97613 | 826234 | 4158.96142 | #VALUE! | #VALUE! | 148186 | 393780 | AUG | 8/14/2020 | 0 | -6% | ||||||||||||||||
| 20200815 | 268 | 0 | 200 | 1.3 | 1.3 | 0 | 4.8% | #VALUE! | #VALUE! | 249 | -7% | 37580 | 74093 | 196890 | 498 | #VALUE! | 98111 | 830737 | 4503.129147 | #VALUE! | #VALUE! | 148186 | 393780 | AUG | 8/15/2020 | 0 | 1% | ||||||||||||||||
| 20200816 | 251 | 0 | 210 | 1.3 | 1.3 | 0 | 4.8% | #VALUE! | #VALUE! | 284 | 8% | 37831 | 74093 | 196890 | 568 | #VALUE! | 98679 | 835462 | 4725.069084 | #VALUE! | #VALUE! | 148186 | 393780 | AUG | 8/16/2020 | 0 | 4% | ||||||||||||||||
| 20200817 | 200 | 1 | 217 | 1.2 | 1.6 | 1 | 4.7% | #VALUE! | #VALUE! | 296 | 13% | 38031 | 74093 | 196890 | 592 | #VALUE! | 99271 | 840342 | 4879.462083 | #VALUE! | #VALUE! | 148186 | 393780 | AUG | 8/17/2020 | 0 | 31% | ||||||||||||||||
| 20200818 | 125 | 0 | 220 | 1.2 | 1.5 | 1 | 4.7% | #VALUE! | #VALUE! | 355 | 74% | 38156 | 74093 | 196890 | 710 | #VALUE! | 99982 | 845286 | 4943.7925 | #VALUE! | #VALUE! | 148186 | 393780 | AUG | 8/18/2020 | 0 | 23% | ||||||||||||||||
| 20200819 | 196 | 1 | 221 | 1.1 | 1.4 | 1 | 4.7% | #VALUE! | #VALUE! | 324 | 40% | 38352 | 74093 | 196890 | 649 | #VALUE! | 100630 | 850258 | 4972.741187 | #VALUE! | #VALUE! | 148186 | 393780 | AUG | 8/19/2020 | 0 | 28% | ||||||||||||||||
| 20200820 | 310 | 2 | 226 | 1.1 | 1.4 | 1 | 4.7% | #VALUE! | #VALUE! | 328 | 59% | 38662 | 74093 | 196890 | 656 | #VALUE! | 101286 | 855350 | 5091.752457 | #VALUE! | #VALUE! | 148186 | 393780 | AUG | 8/20/2020 | 0 | 28% | ||||||||||||||||
| 20200821 | 264 | 0 | 231 | 1.1 | 1.3 | 1 | 4.7% | #VALUE! | #VALUE! | 324 | 39% | 38926 | 74093 | 196890 | 648 | #VALUE! | 101934 | 860542 | 5191.464603 | #VALUE! | #VALUE! | 148186 | 393780 | AUG | 8/21/2020 | 0 | 22% | ||||||||||||||||
| 20200822 | 306 | 0 | 236 | 1.1 | 1.3 | 1 | 4.6% | #VALUE! | #VALUE! | 314 | 22% | 39232 | 74093 | 196890 | 628 | #VALUE! | 102562 | 865855 | 5313.692394 | #VALUE! | #VALUE! | 148186 | 393780 | AUG | 8/22/2020 | 0 | 19% | ||||||||||||||||
| 20200823 | 294 | 1 | 242 | 1.1 | 1.2 | 1 | 4.6% | #VALUE! | #VALUE! | 317 | 15% | 39526 | 74093 | 196890 | 635 | #VALUE! | 103197 | 871307 | 5452.002789 | #VALUE! | #VALUE! | 148186 | 393780 | AUG | 8/23/2020 | 0 | 10% | ||||||||||||||||
| 20200824 | 276 | 0 | 253 | 1.1 | 1.2 | 1 | 4.6% | #VALUE! | #VALUE! | 320 | 2% | 39802 | 74093 | 196890 | 640 | #VALUE! | 103837 | 877004 | 5696.458371 | #VALUE! | #VALUE! | 148186 | 393780 | AUG | 8/24/2020 | 0 | 8% | ||||||||||||||||
| 20200825 | 157 | 1 | 258 | 1.1 | 1.2 | 1 | 4.6% | #VALUE! | #VALUE! | 316 | -9% | 39959 | 74093 | 196890 | 632 | #VALUE! | 104469 | 882803 | 5799.387038 | #VALUE! | #VALUE! | 148186 | 393780 | AUG | 8/25/2020 | 0 | 6% | ||||||||||||||||
| 20200826 | 202 | 2 | 258 | 1.1 | 1.2 | 1 | 4.5% | #VALUE! | #VALUE! | 308 | -13% | 40161 | 74093 | 196890 | 616 | #VALUE! | 105086 | 888622 | 5818.686163 | #VALUE! | #VALUE! | 148186 | 393780 | AUG | 8/26/2020 | 0 | 7% | ||||||||||||||||
| 20200827 | 379 | 0 | 268 | 1.1 | 1.2 | 1 | 4.5% | #VALUE! | #VALUE! | 328 | -24% | 40540 | 74093 | 196890 | 656 | #VALUE! | 105741 | 894662 | 6040.626099 | #VALUE! | #VALUE! | 148186 | 393780 | AUG | 8/27/2020 | 0 | 10% | ||||||||||||||||
| 20200828 | 360 | 1 | 282 | 1.1 | 1.2 | 1 | 4.5% | #VALUE! | #VALUE! | 360 | -13% | 40900 | 74093 | 196890 | 720 | #VALUE! | 106462 | 901012 | 6349.412098 | #VALUE! | #VALUE! | 148186 | 393780 | AUG | 8/28/2020 | 0 | 12% | ||||||||||||||||
| 20200829 | 340 | 1 | 287 | 1.1 | 1.2 | 1 | 4.4% | #VALUE! | #VALUE! | 364 | -12% | 41240 | 74093 | 196890 | 728 | #VALUE! | 107189 | 907471 | 6458.773806 | #VALUE! | #VALUE! | 148186 | 393780 | AUG | 8/29/2020 | 0 | 12% | ||||||||||||||||
| 20200830 | 375 | 0 | 298 | 1.2 | 1.3 | 1 | 4.4% | #VALUE! | #VALUE! | 386 | -8% | 41615 | 74093 | 196890 | 773 | #VALUE! | 107962 | 914190 | 6719.311992 | #VALUE! | #VALUE! | 148186 | 393780 | AUG | 8/30/2020 | 0 | 10% | ||||||||||||||||
| 20200831 | 291 | 0 | 301 | 1.1 | 1.2 | 1 | 4.4% | #VALUE! | #VALUE! | 383 | -4% | 41906 | 74093 | 196890 | 766 | #VALUE! | 108727 | 920957 | 6767.559804 | #VALUE! | #VALUE! | 148186 | 393780 | AUG | 8/31/2020 | 0 | 11% | ||||||||||||||||
| 20200901 | 163 | 1 | 301 | 1.1 | 1.2 | 1 | 4.4% | #VALUE! | #VALUE! | 375 | -5% | 42069 | 74093 | 196890 | 750 | #VALUE! | 109478 | 927744 | 6786.858929 | #VALUE! | #VALUE! | 148186 | 393780 | SEP | 9/1/2020 | 0 | 11% | ||||||||||||||||
| 20200902 | 216 | 1 | 303 | 1.1 | 1.2 | 1 | 4.3% | #VALUE! | #VALUE! | 364 | -5% | 42285 | 74093 | 196890 | 728 | #VALUE! | 110206 | 934576 | 6831.890221 | #VALUE! | #VALUE! | 148186 | 393780 | SEP | 9/2/2020 | 0 | 11% | ||||||||||||||||
| 20200903 | 370 | 0 | 302 | 1.0 | 1.2 | 1 | 4.3% | #VALUE! | #VALUE! | 354 | -4% | 42655 | 74093 | 196890 | 709 | #VALUE! | 110915 | 941379 | 6802.941533 | #VALUE! | #VALUE! | 148186 | 393780 | SEP | 9/3/2020 | 0 | 15% | ||||||||||||||||
| 20200904 | 472 | 4 | 318 | 1.1 | 1.2 | 1 | 4.3% | #VALUE! | #VALUE! | 392 | 3% | 43127 | 74093 | 196890 | 783 | #VALUE! | 111698 | 948542 | 7163.191865 | #VALUE! | #VALUE! | 148186 | 393780 | SEP | 9/4/2020 | 0 | 12% | ||||||||||||||||
| 20200905 | 297 | 1 | 312 | 1.0 | 1.1 | 1 | 4.3% | #VALUE! | #VALUE! | 363 | -5% | 43424 | 74093 | 196890 | 726 | #VALUE! | 112423 | 955567 | 7024.88147 | #VALUE! | #VALUE! | 148186 | 393780 | SEP | 9/5/2020 | 0 | 7% | ||||||||||||||||
| 20200906 | 425 | 0 | 319 | 1.1 | 1.1 | 1 | 4.2% | #VALUE! | #VALUE! | 361 | -11% | 43849 | 74093 | 196890 | 722 | #VALUE! | 113146 | 962753 | 7185.707511 | #VALUE! | #VALUE! | 148186 | 393780 | SEP | 9/6/2020 | 0 | 6% | ||||||||||||||||
| 20200907 | 444 | 1 | 341 | 1.1 | 1.1 | 1 | 4.2% | #VALUE! | #VALUE! | 405 | -6% | 44293 | 74093 | 196890 | 811 | #VALUE! | 113957 | 970431 | 7677.835196 | #VALUE! | #VALUE! | 148186 | 393780 | SEP | 9/7/2020 | 0 | 1% | ||||||||||||||||
| 20200908 | 191 | 2 | 345 | 1.1 | 1.1 | 1 | 4.2% | #VALUE! | #VALUE! | 399 | -11% | 44484 | 74093 | 196890 | 798 | #VALUE! | 114754 | 978199 | 7767.897779 | #VALUE! | #VALUE! | 148186 | 393780 | SEP | 9/8/2020 | 0 | 6% | ||||||||||||||||
| 20200909 | 245 | 0 | 349 | 1.1 | 1.2 | 1 | 4.1% | #VALUE! | #VALUE! | 406 | -9% | 44729 | 74093 | 196890 | 811 | #VALUE! | 115565 | 986060 | 7861.176883 | #VALUE! | #VALUE! | 148186 | 393780 | SEP | 9/9/2020 | 0 | 4% | ||||||||||||||||
| 20200910 | 468 | 0 | 363 | 1.1 | 1.2 | 1 | 4.1% | #VALUE! | #VALUE! | 437 | -3% | 45197 | 74093 | 196890 | 875 | #VALUE! | 116440 | 994236 | 8176.395923 | #VALUE! | #VALUE! | 148186 | 393780 | SEP | 9/10/2020 | 0 | 5% | ||||||||||||||||
| 20200911 | 405 | 2 | 354 | 1.0 | 1.2 | 1 | 4.1% | #VALUE! | #VALUE! | 412 | -3% | 45602 | 74093 | 196890 | 824 | #VALUE! | 117264 | 1002197 | 7960.889028 | #VALUE! | #VALUE! | 148186 | 393780 | SEP | 9/11/2020 | 0 | 13% | ||||||||||||||||
| 20200912 | 528 | 3 | 387 | 1.1 | 1.2 | 1 | 4.1% | #VALUE! | #VALUE! | 495 | 9% | 46130 | 74093 | 196890 | 989 | #VALUE! | 118254 | 1010901 | 8703.905338 | #VALUE! | #VALUE! | 148186 | 393780 | SEP | 9/12/2020 | 0 | 8% | ||||||||||||||||
| 20200913 | 465 | 3 | 392 | 1.1 | 1.3 | 2 | 4.0% | #VALUE! | #VALUE! | 484 | 0% | 46595 | 74093 | 196890 | 967 | #VALUE! | 119221 | 1019734 | 8832.566171 | #VALUE! | #VALUE! | 148186 | 393780 | SEP | 9/13/2020 | 0 | 12% | ||||||||||||||||
| 20200914 | 473 | 4 | 396 | 1.1 | 1.2 | 2 | 4.0% | #VALUE! | #VALUE! | 504 | 9% | 47068 | 74093 | 196890 | 1007 | #VALUE! | 120228 | 1028659 | 8925.845274 | #VALUE! | #VALUE! | 148186 | 393780 | SEP | 9/14/2020 | 0 | 14% | ||||||||||||||||
| 20200915 | 257 | 0 | 406 | 1.1 | 1.2 | 2 | 4.0% | #VALUE! | #VALUE! | 516 | 12% | 47325 | 74093 | 196890 | 1032 | #VALUE! | 121261 | 1037798 | 9138.135648 | #VALUE! | #VALUE! | 148186 | 393780 | SEP | 9/15/2020 | 0 | 4% | ||||||||||||||||
| 20200916 | 315 | 1 | 416 | 1.1 | 1.2 | 2 | 3.9% | #VALUE! | #VALUE! | 507 | 3% | 47640 | 74093 | 196890 | 1014 | #VALUE! | 122275 | 1047161 | 9363.292106 | #VALUE! | #VALUE! | 148186 | 393780 | 16 | 9/16/2020 | 0 | 12% | ||||||||||||||||
| 20200917 | 514 | 7 | 422 | 1.1 | 1.2 | 3 | 3.9% | #VALUE! | #VALUE! | 517 | 6% | 48154 | 74093 | 196890 | 1034 | #VALUE! | 123309 | 1056672 | 9511.252063 | #VALUE! | #VALUE! | 148186 | 393780 | 17 | 9/17/2020 | 0 | 12% | ||||||||||||||||
| 20200918 | 530 | 8 | 440 | 1.1 | 1.2 | 4 | 3.9% | #VALUE! | #VALUE! | 555 | 9% | 48684 | 74093 | 196890 | 1110 | #VALUE! | 124420 | 1066585 | 9913.317166 | #VALUE! | #VALUE! | 148186 | 393780 | 18 | 9/18/2020 | 0 | 9% | ||||||||||||||||
| 20200919 | 487 | 2 | 434 | 1.1 | 1.2 | 4 | 3.9% | #VALUE! | #VALUE! | 520 | -1% | 49171 | 74093 | 196890 | 1039 | #VALUE! | 125459 | 1076367 | 9781.439812 | #VALUE! | #VALUE! | 148186 | 393780 | 19 | 9/19/2020 | 0 | 15% | ||||||||||||||||
| 20200920 | 0 | 0 | 368 | 0.9 | 1.0 | 3 | 3.8% | #VALUE! | #VALUE! | 383 | -11% | 49171 | 74093 | 196890 | 766 | #VALUE! | 126225 | 1084653 | 8285.757631 | #VALUE! | #VALUE! | 148186 | 393780 | 20 | 9/20/2020 | 0 | 8% | ||||||||||||||||
| 20200921 | 0 | 0 | 300 | 0.7 | 0.8 | 3 | 3.8% | #VALUE! | #VALUE! | 233 | -39% | 49171 | 74093 | 196890 | 467 | #VALUE! | 126692 | 1091417 | 6764.343284 | #VALUE! | #VALUE! | 148186 | 393780 | 21 | 9/21/2020 | 0 | 8% | ||||||||||||||||
| 20200922 | 1093 | 5 | 420 | 1.0 | 1.1 | 3 | 3.8% | #VALUE! | #VALUE! | 449 | -13% | 50264 | 74093 | 196890 | 899 | #VALUE! | 127591 | 1100870 | 9453.354689 | #VALUE! | #VALUE! | 148186 | 393780 | 22 | 9/22/2020 | 0 | 11% | ||||||||||||||||
| 20200923 | 284 | 3 | 415 | 1.0 | 1.0 | 4 | 3.8% | #VALUE! | #VALUE! | 435 | -18% | 50548 | 74093 | 196890 | 871 | #VALUE! | 128462 | 1110224 | 9353.642543 | #VALUE! | #VALUE! | 148186 | 393780 | 23 | 9/23/2020 | 0 | 7% | ||||||||||||||||
| 20200924 | 436 | 0 | 404 | 1.1 | 1.0 | 3 | 3.7% | #VALUE! | #VALUE! | 403 | -22% | 50984 | 74093 | 196890 | 805 | #VALUE! | 129267 | 1119327 | 9102.753919 | #VALUE! | #VALUE! | 148186 | 393780 | 24 | 9/24/2020 | 0 | -12% | ||||||||||||||||
| 20200925 | 508 | 4 | 401 | 1.3 | 0.9 | 2 | 3.7% | #VALUE! | #VALUE! | 387 | -21% | 51492 | 74093 | 196890 | 774 | #VALUE! | 130041 | 1128359 | 9031.990461 | #VALUE! | #VALUE! | 148186 | 393780 | 25 | 9/25/2020 | 0 | -29% | ||||||||||||||||
| 20200926 | 255 | 1 | 368 | 0.9 | 0.8 | 2 | 3.7% | #VALUE! | #VALUE! | 321 | -29% | 51747 | 74093 | 196890 | 641 | #VALUE! | 130682 | 1136644 | 8285.757631 | #VALUE! | #VALUE! | 148186 | 393780 | 26 | 9/26/2020 | 0 | -5% | ||||||||||||||||
| 20200927 | 117 | 1 | 385 | 0.9 | 0.9 | 2 | 3.7% | #VALUE! | #VALUE! | 336 | -31% | 51864 | 74093 | 196890 | 672 | #VALUE! | 131354 | 1145307 | 8662.090567 | #VALUE! | #VALUE! | 148186 | 393780 | 27 | 9/27/2020 | 0 | -4% | ||||||||||||||||
| 20200928 | 0 | 0 | 385 | 1.0 | 1.0 | 2 | 3.6% | #VALUE! | #VALUE! | 341 | -26% | 51864 | 74093 | 196890 | 681 | #VALUE! | 132036 | 1153969 | 8662.090567 | #VALUE! | #VALUE! | 148186 | 393780 | 28 | 9/28/2020 | 0 | 10% | ||||||||||||||||
| 20200929 | 664 | 1 | 323 | 0.8 | 1.1 | 1 | 3.6% | #VALUE! | #VALUE! | 284 | -16% | 52528 | 74093 | 196890 | 569 | #VALUE! | 132604 | 1161251 | 7282.203135 | #VALUE! | #VALUE! | 148186 | 393780 | 29 | 9/29/2020 | 0 | 34% | ||||||||||||||||
| 20200930 | 223 | 2 | 315 | 0.9 | 0.7 | 1 | 3.6% | #VALUE! | #VALUE! | 330 | 35% | 52751 | 74093 | 196890 | 659 | #VALUE! | 133264 | 1168337 | 7085.995365 | #VALUE! | #VALUE! | 148186 | 393780 | 30 | 9/30/2020 | 0 | -12% | ||||||||||||||||
| 20201001 | 411 | 1 | 311 | 0.8 | 0.7 | 1 | 3.5% | #VALUE! | #VALUE! | 231 | -31% | 53162 | 74093 | 196890 | 461 | #VALUE! | 133725 | 1175342 | 7005.582345 | #VALUE! | #VALUE! | 148186 | 393780 | 1 | 10/1/2020 | 0 | -7% | ||||||||||||||||
| 20201002 | 550 | 1 | 317 | 0.8 | 0.8 | 1 | 3.5% | #VALUE! | #VALUE! | 242 | -27% | 53712 | 74093 | 196890 | 484 | #VALUE! | 134209 | 1182483 | 7140.676219 | #VALUE! | #VALUE! | 148186 | 393780 | 2 | 10/2/2020 | 0 | -5% | ||||||||||||||||
| 20201003 | 551 | 0 | 359 | 1.1 | 0.9 | 1 | 3.5% | #VALUE! | #VALUE! | 320 | -11% | 54263 | 74093 | 196890 | 639 | #VALUE! | 134848 | 1190576 | 8092.766382 | #VALUE! | #VALUE! | 148186 | 393780 | 3 | 10/3/2020 | 0 | -19% | ||||||||||||||||
| 20201004 | 0 | 0 | 343 | 1.1 | 0.9 | 1 | 3.5% | #VALUE! | #VALUE! | 293 | -11% | 54263 | 74093 | 196890 | 586 | #VALUE! | 135434 | 1198292 | 7716.433446 | #VALUE! | #VALUE! | 148186 | 393780 | 4 | 10/4/2020 | 0 | -14% | ||||||||||||||||
| 20201005 | 0 | 0 | 343 | 1.1 | 0.9 | 1 | 3.5% | #VALUE! | #VALUE! | 319 | 7% | 54263 | 74093 | 196890 | 638 | #VALUE! | 136072 | 1206009 | 7716.433446 | #VALUE! | #VALUE! | 148186 | 393780 | 5 | 10/5/2020 | 0 | -19% | ||||||||||||||||
| 20201006 | 1540 | 3 | 468 | 1.5 | 1.2 | 1 | 3.4% | #VALUE! | #VALUE! | 569 | 39% | 55803 | 74093 | 196890 | 1138 | #VALUE! | 137210 | 1216543 | 10534.10568 | #VALUE! | #VALUE! | 148186 | 393780 | 6 | 10/6/2020 | 0 | -18% | ||||||||||||||||
| 20201007 | 699 | 0 | 536 | 1.5 | 1.7 | 1 | 3.4% | #VALUE! | #VALUE! | 746 | 57% | 56502 | 74093 | 196890 | 1493 | #VALUE! | 138703 | 1228608 | 12065.16959 | #VALUE! | #VALUE! | 148186 | 393780 | 7 | 10/7/2020 | 0 | 11% | ||||||||||||||||
| 20201008 | 0 | 0 | 477 | 1.4 | 1.5 | 1 | 3.4% | #VALUE! | #VALUE! | 704 | 68% | 56502 | 74093 | 196890 | 1408 | #VALUE! | 140111 | 1239351 | 10743.17954 | #VALUE! | #VALUE! | 148186 | 393780 | 8 | 10/8/2020 | 0 | 9% | ||||||||||||||||
| 20201009 | 2243 | 4 | 719 | 2.1 | 2.3 | 1 | 3.4% | #VALUE! | #VALUE! | 1643 | 118% | 58745 | 74093 | 196890 | 3285 | #VALUE! | 143396 | 1255540 | 16188.74928 | #VALUE! | #VALUE! | 148186 | 393780 | 9 | 10/9/2020 | 0 | 10% | ||||||||||||||||
| 20201010 | 1485 | 3 | 852 | 1.8 | 2.7 | 1 | 3.4% | #VALUE! | #VALUE! | 2335 | 270% | 60230 | 74093 | 196890 | 4671 | #VALUE! | 148067 | 1274733 | 19192.97973 | #VALUE! | #VALUE! | 148186 | 393780 | 10 | 10/10/2020 | 0 | 48% | ||||||||||||||||
| 20201011 | 0 | 0 | 852 | 1.6 | 2.4 | 1 | 3.3% | #VALUE! | #VALUE! | 2291 | 252% | 60230 | 74093 | 196890 | 4582 | #VALUE! | 152649 | 1293926 | 19192.97973 | #VALUE! | #VALUE! | 148186 | 393780 | 11 | 10/11/2020 | 35495 | 49% | ||||||||||||||||
| 20201012 | 0 | 0 | 852 | 1.8 | 2.5 | 1 | 3.3% | #VALUE! | #VALUE! | 2022 | 167% | 60230 | 74093 | 196890 | 4043 | #VALUE! | 156692 | 1313119 | 19192.97973 | #VALUE! | #VALUE! | 148186 | 393780 | 12 | 10/12/2020 | 73533 | 39% | ||||||||||||||||
| 20201013 | 4057 | 7 | 1212 | 1.7 | 3.5 | 2 | 3.3% | #VALUE! | #VALUE! | 4286 | 314% | 64287 | 74093 | 196890 | 8572 | #VALUE! | 165265 | 1340408 | 27288.96263 | #VALUE! | #VALUE! | 148186 | 393780 | 13 | 10/13/2020 | no | 110% | ||||||||||||||||
| 20201014 | 1439 | 7 | 1318 | 1.5 | 2.8 | 3 | 3.3% | #VALUE! | #VALUE! | 5067 | 313% | 65726 | 74093 | 196890 | 10133 | #VALUE! | 175398 | 1370077 | 29669.18804 | #VALUE! | #VALUE! | 148186 | 393780 | 14 | 10/14/2020 | no | 82% | ||||||||||||||||
| 20201015 | 2724 | 7 | 1707 | 2.0 | 3.2 | 4 | 3.2% | #VALUE! | #VALUE! | 6227 | 200% | 68450 | 74093 | 196890 | 12454 | #VALUE! | 187852 | 1408508 | 38430.99075 | #VALUE! | #VALUE! | 148186 | 393780 | 15 | 10/15/2020 | no | 59% | ||||||||||||||||
| 20201016 | 2690 | 3 | 1771 | 2.1 | 3.7 | 4 | 3.2% | #VALUE! | #VALUE! | 5851 | 137% | 71140 | 74093 | 196890 | 11702 | #VALUE! | 199554 | 1448377 | 39868.77556 | #VALUE! | #VALUE! | 148186 | 393780 | 16 | 10/16/2020 | no | 79% | ||||||||||||||||
| 20201017 | 3087 | 5 | 2000 | 1.6 | 2.8 | 4 | 3.1% | #VALUE! | #VALUE! | 8380 | 184% | 74227 | 74093 | 196890 | 16759 | #VALUE! | 216314 | 1493398 | 45021.64191 | #VALUE! | #VALUE! | 148186 | 393780 | 17 | 10/17/2020 | no | 69% | ||||||||||||||||
| 20201018 | 0 | 0 | 2000 | 1.5 | 2.3 | 4 | 3.1% | #VALUE! | #VALUE! | 5561 | 22% | 74227 | 74093 | 196890 | 11122 | #VALUE! | 227435 | 1538420 | 45021.64191 | #VALUE! | #VALUE! | 148186 | 393780 | 18 | 10/18/2020 | no | 55% | ||||||||||||||||
| 20201019 | 195 | 1 | 2027 | 1.2 | 2.4 | 4 | 3.0% | #VALUE! | #VALUE! | 4822 | -13% | 74422 | 74093 | 196890 | 9644 | #VALUE! | 237080 | 1584069 | 45648.86347 | #VALUE! | #VALUE! | 148186 | 393780 | 19 | 10/19/2020 | no | 100% | ||||||||||||||||
| 20201020 | 8737 | 14 | 2696 | 1.5 | 3.2 | 5 | 3.0% | 3.3% | 0.9 | 6679 | 17747 | 8527 | 18% | 83159 | 80772 | 214637 | 17053 | #VALUE! | 254133 | 1644771 | 60702.18091 | 13357 | 35495 | 161543 | 429274 | 20 | 10/20/2020 | no | 108% | ||||||||||||||
| 20201021 | 3008 | 7 | 2920 | 1.5 | 2.4 | 5 | 2.9% | 3.2% | 0.9 | 7157 | 19019 | 10003 | 44% | 86167 | 87929 | 233656 | 20007 | #VALUE! | 274140 | 1710520 | 65748.90207 | 14314 | 38038 | 175858 | 467312 | 21 | 10/21/2020 | no | 65% | ||||||||||||||
| Grand Total | 86167 | 1844 | 22 | ||||||||||||||||||||||||||||||||||||||||
| 23 | |||||||||||||||||||||||||||||||||||||||||||
| With the shuttdown, many countries have contained exponential growth. (But not all yet) | 24 | ||||||||||||||||||||||||||||||||||||||||||
|
25 | ||||||||||||||||||||||||||||||||||||||||||
| 26 | |||||||||||||||||||||||||||||||||||||||||||